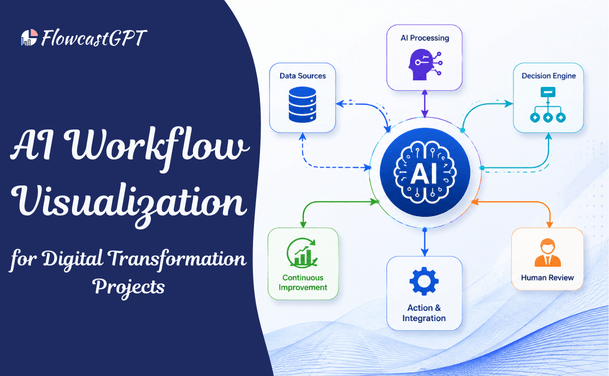
AI is reshaping how teams visualize ideas — from architecture flows to product roadmaps. Here's how to weave these tools into what you already use, without disrupting your workflow or losing design quality.
For years, diagramming lived at the intersection of tedium and expertise. You needed to know the notation (UML? BPMN? C4?), you needed the patience to drag shapes and connect nodes, and you needed time — plenty of it. A system architecture diagram that took a senior engineer three hours to produce would be outdated by the next sprint.
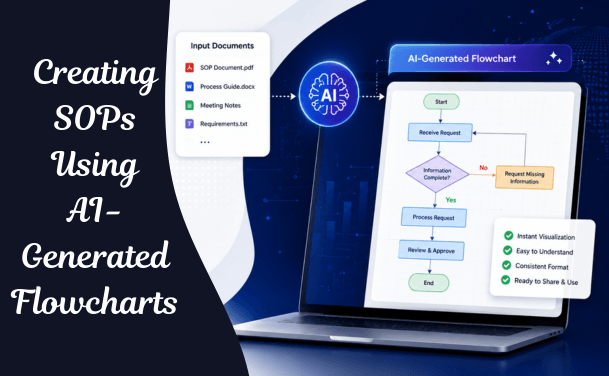
AI diagramming tools change that equation fundamentally. Instead of building diagrams by hand, you describe what you need — in plain language, in code, in a rough sketch — and the tool produces a structured, editable visual in seconds. The result isn't just speed. It's a shift in who can create diagrams and when in the process they get made.
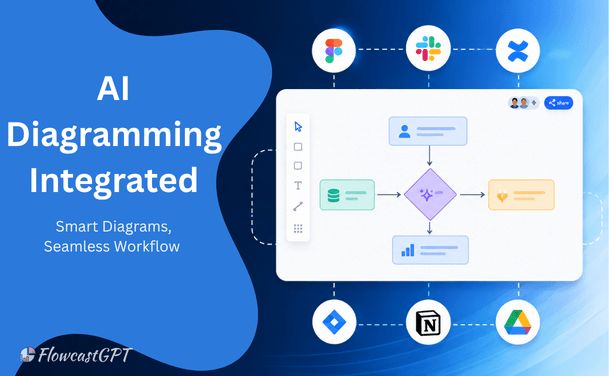
But the promise comes with real integration challenges. Most teams already have a design stack: Figma or Sketch for UI, Miro or Lucidchart for whiteboarding, Confluence or Notion for documentation, GitHub or Jira for engineering. Introducing a new category of AI tool — without thinking carefully about where it fits — risks tool sprawl, version confusion, and adoption fatigue.
This guide is about doing it right.
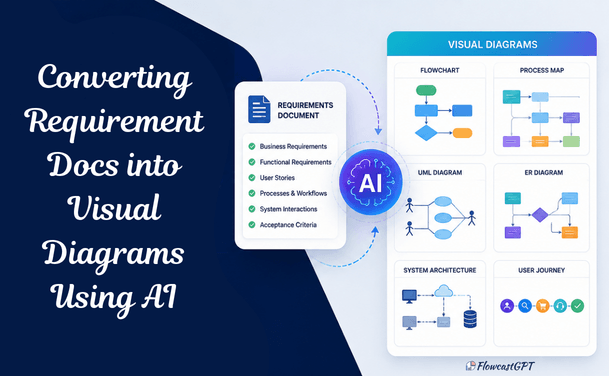
Before integrating anything, you need to understand what's actually out there. AI diagramming tools fall into roughly four categories, each with different integration profiles:
You write a description or paste a prompt; the tool generates a diagram. Strong for flowcharts, sequence diagrams, and entity relationships.
Familiar tools like Miro and Lucidchart now embed AI assistants that auto-layout, suggest connections, and summarize diagrams.
Diagram-as-code tools (Mermaid, PlantUML, D2) with AI layers that generate markup from natural language or existing code files.
Figma and similar tools now offer AI features that can scaffold flows, convert wireframes to diagrams, and auto-generate component maps.
Each category integrates differently into a design stack, serves different audiences, and has different output formats. Understanding where a tool lives in this landscape is the first step to evaluating whether it fits your workflow.
A quick comparison of popular options
| Tool | Input Method | Exports | API/Plugin | Best for |
|---|---|---|---|---|
| FlowcastGPT | Natural language, text | SVG, PNG, shareable URL | Planned | Quick flowcharts, broad audiences |
| Eraser AI | Natural language, code | SVG, PNG, Markdown | Yes | Engineering docs |
| Miro AI | Prompt, whiteboard | PDF, PNG, Miro | Yes | Cross-functional teams |
| Lucidchart AI | Prompt, import | PDF, Visio, SVG | Yes | Enterprise workflows |
| Whimsical AI | Prompt | PNG, PDF | Limited | Product ideation |
| Mermaid + AI | Code, prompt | SVG, PNG, HTML | Yes | Dev-led documentation |
| Napkin AI | Natural language, text | SVG, PNG | No | Presentations, quick visuals |
Also read: Key Considerations When Choosing an AI Diagramming Tool for Complex System Architectures
One of the most common integration mistakes is treating AI diagramming as a direct replacement for an existing tool. It rarely is. More often, it fills gaps in your existing stack — the moments where a diagram should exist but doesn't because creating it would take too long.
Mapping to your existing stack Think of your design stack as operating across three distinct phases: exploration (early ideation, whiteboarding), specification (detailed design, documentation), and communication (sharing across teams, stakeholders, and external audiences). AI diagramming tools are most powerful in the transition points between these phases.
Key insight: AI diagramming tools shine brightest at the transition from exploration to specification — when a rough idea needs to become a structured, communicable artifact quickly. Trying to replace fully-specified design documentation with AI output is where teams run into trouble.
In practical terms, this means:
This framing — AI as an accelerant, not a replacement — is what separates successful integrations from expensive experiments.
Check out: How QA Teams Can Use AI Diagram Generators
How deeply you integrate an AI diagramming tool should match how frequently your team produces diagrams and how central those diagrams are to your workflow. Here are three integration tiers to consider:
Use the AI tool independently, export diagrams as PNG or SVG, and embed them manually in Confluence, Notion, or Google Docs. This requires zero technical setup and is the right starting point for teams piloting the technology. The downside: diagrams become static assets that go stale.
Most major AI diagramming tools now offer plugins for Figma, integrations with Notion and Confluence, and embed codes for documentation platforms. At this tier, diagrams live in the right context and can be updated without leaving your documentation tool. This is the sweet spot for most teams — meaningful workflow improvement with manageable setup overhead.
For engineering-heavy teams, diagram-as-code tools like Mermaid or D2 integrated with an AI layer allow diagrams to live alongside code in version control, auto-update when architecture changes, and render directly in documentation pipelines. This is the most powerful approach but requires investment in tooling and team conventions.
Recommended path for most teams: Start at Tier 1 for two to four weeks to understand how your team naturally uses the tool. Upgrade to Tier 2 once you've identified the two or three diagram types your team creates most frequently. Only invest in Tier 3 if diagrams are genuinely central to your engineering or product process.
Abstract integration strategies only go so far. Here are four concrete workflows that teams are using successfully:
Before any engineering meeting about a new system or feature, an engineer pastes a rough description into an AI diagramming tool and generates a starting architecture diagram. This diagram doesn't need to be correct — it needs to be discussable. Having a visual on screen at the start of a meeting cuts alignment time dramatically and gives everyone a shared reference point to correct.
Designers paste their Figma component descriptions or user flow notes into an AI diagramming tool and generate corresponding flow diagrams that get automatically embedded in Confluence. The diagrams aren't a separate deliverable — they're a by-product of the design process itself.
When a new engineer joins, a script pulls the team's system architecture from a YAML config file and generates a current, accurate system diagram automatically. No manual maintenance, no outdated diagrams in the onboarding doc.
After a sprint, a PM pastes the sprint's Jira ticket summaries into an AI diagramming tool and gets a visual dependency map showing how work is connected across the team. This makes blockers, handoffs, and team structure visible in a way that ticket lists don't.
Audit the last month of your team's work. Where did you wish you had a diagram? Where did you have one that was outdated?
Don't try to automate everything. Choose the single diagram type your team creates most often: flowcharts, sequence diagrams, system maps.
Give a small group the tool and one specific workflow. Gather feedback on fit, friction, and output quality before scaling.
Establish a clear rule: all final diagrams live in [Confluence / Notion / GitHub]. AI-generated drafts can live anywhere, but published diagrams have a canonical home.
Assign ownership of key diagrams. Add "update architecture diagram" as a checklist item in your PR template or sprint completion checklist.
Also check: From Idea to Diagram in 30 Seconds: A Complete Guide
Integrating AI diagramming tools is genuinely easy to get wrong. The following pitfalls come up repeatedly in teams making this transition:
AI-generated diagrams are a starting point. They compress creation time dramatically, but the output often needs human refinement — especially for complex or politically sensitive architectural diagrams where the structure of a diagram signals organizational decisions.
If one team uses Miro AI, another uses Lucidchart, and engineers generate Mermaid diagrams locally, you end up with no single source of truth. Standardize on one or two tools with clear use-case boundaries.
AI makes it easy to generate a new diagram — which makes it easy to overwrite an old one without realizing it. Use your documentation tool's version history features, or treat diagram-as-code approaches where the file history is the version history.
AI-generated diagrams are often images. Images without alt text are inaccessible. If your diagrams are embedded in documentation, establish a convention for providing descriptive alt text or accompanying text summaries.
The output quality of AI diagramming tools is directly proportional to the quality and specificity of your input. Vague prompts produce vague diagrams. Invest time in building a team prompt library for your most common diagram types.
Use this checklist before rolling out an AI diagramming tool to your team:
This depends on the tool's data handling policy. Many enterprise-tier offerings (Lucidchart Enterprise, Miro Business) offer data processing agreements and do not train on user input. For highly sensitive architectures, diagram-as-code tools run locally (like D2 or Mermaid CLI) give you full control over where data goes. Always check the privacy policy before inputting anything confidential into a cloud-based AI tool.
The most robust approach is diagram-as-code: keep a Mermaid or D2 file in your repository, and use an AI tool to regenerate the markup when the underlying system changes. For non-engineering teams, Miro and Lucidchart's live data integrations can pull from external sources to auto-update elements of a diagram. At minimum, assign a named owner for every critical diagram and add an "update check" step to your sprint or release process.
For product teams, Whimsical AI and Miro AI tend to perform well — both prioritize user flow diagrams, journey maps, and feature dependency charts. Whimsical is particularly strong for early-stage ideation with its clean, opinionated interface. Miro is better when your product team already lives in Miro for workshops and planning. If your team writes detailed specs in Notion or Confluence, look for tools with native embeds in those platforms.
Accuracy varies significantly by tool and diagram type. Class diagrams and sequence diagrams tend to be well-supported. More complex UML types (state machines, activity diagrams with swim lanes) can be hit or miss. Mermaid-based tools and PlantUML with AI overlays tend to be most reliable for standard notation since they generate text-based markup that follows a strict spec. Always validate AI-generated UML output before using it in formal documentation.
The barrier is usually prompt anxiety — people don't know what to say to get a useful diagram. The most effective approach is to build a short library of starter prompts for the diagram types your team uses most: one for user flows, one for system architecture overviews, one for org charts. Give people a template to edit rather than a blank canvas to fill. Most people who try AI diagramming with a good starter prompt become enthusiastic adopters within the first session.
AI diagramming tools are not a future technology. They are a present-tense productivity lever that teams who use them well are pulling right now — shipping clearer documentation faster, running more aligned meetings, and onboarding new team members with visuals that stay current.
The integration challenge is real, but it's fundamentally a process challenge, not a technical one. The teams that struggle are the ones who add a new tool without answering the question: where does this live in relation to everything else we already use? Answer that question first, and the rest of the integration tends to follow naturally.
Start small. Pick one diagram type, one workflow, one team. The ROI in that narrow context is usually enough to make the case for expanding.