Every customer interaction shapes how people perceive a business. From discovering a product and comparing alternatives to making a purchase, contacting support, and renewing a subscription, customers experience a brand through multiple touchpoints.
However, these interactions rarely happen in one place. Customers may move between websites, mobile applications, emails, social media, sales representatives, physical stores, and customer support channels before completing a single journey.
For businesses, understanding how these interactions connect is essential. A confusing checkout process, delayed response from customer support, inconsistent communication, or complicated onboarding experience can affect customer satisfaction and loyalty.
This is where customer journey mapping becomes valuable.
Customer journey mapping helps businesses visualize the complete experience customers have with a brand, identify important touchpoints, understand customer expectations, and uncover areas that need improvement.
Artificial intelligence (AI) is making this process more accessible by helping teams transform written descriptions, customer scenarios, and business requirements into visual diagrams. Instead of manually arranging every activity and connection, teams can use AI diagramming tools to generate an initial representation of the customer journey and refine it collaboratively.
But how does customer journey mapping with AI-generated diagrams work? What information should businesses include, which diagram types are useful, and how can AI help identify opportunities to improve customer experiences?
This guide explores the fundamentals of customer journey mapping, practical applications of AI-generated diagrams, implementation steps, examples, benefits, and best practices.
Read: AI Diagram Generator - The Complete Guide for Teams and Enterprises
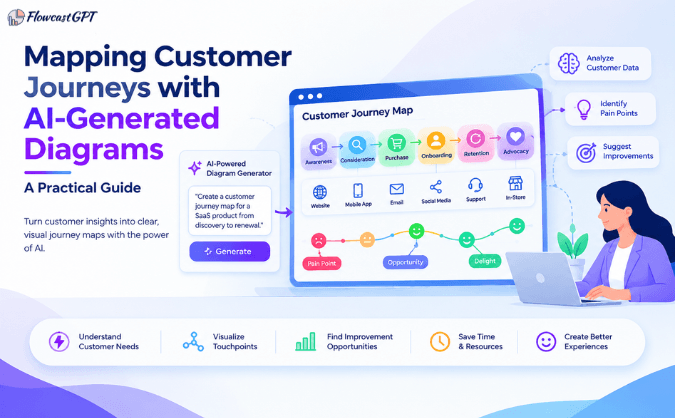
Customer journey mapping is the process of visually representing the different stages and interactions a customer experiences while engaging with a business, product, or service.
It helps organizations understand the customer experience from the customer's perspective rather than looking only at internal business processes.
A customer journey map typically illustrates:
For example, consider someone purchasing a subscription-based software product.
The journey may begin when the person discovers the product through a search engine. They visit the website, explore features, compare pricing, sign up for a trial, receive onboarding emails, and eventually purchase a subscription.
After purchasing, they may contact customer support, explore additional features, and renew their subscription.
A customer journey map brings these interactions together into one visual representation, making it easier for different teams to understand the experience.
Although customer journeys differ across industries and business models, many follow a common structure.
The customer discovers a brand, product, or service through search engines, social media, advertisements, recommendations, or other channels.
The customer evaluates available options, compares features and pricing, reads reviews, and looks for information that can help with the purchasing decision.
The customer chooses a product or service, completes a purchase, signs a contract, or registers for an account.
The customer starts using the product or service, receives guidance, explores features, and becomes familiar with the experience.
The customer continues using the product or service and may interact with customer support, account managers, or self-service resources.
Satisfied customers may renew subscriptions, make repeat purchases, recommend the business, or share positive experiences.
These stages provide a starting framework. Some customer journeys include additional stages, while others involve repeated interactions between stages. The exact structure depends on the business model and the customer experience being mapped.
Also read: AI Diagramming Tools vs Diagram-as-Code - Which Is Better?
Businesses often manage customer interactions through separate departments and systems. Marketing may focus on website visits and campaign engagement, sales teams may track leads and opportunities, and customer support may monitor tickets and complaints.
Although each team manages an important part of the experience, customers do not necessarily see these interactions as separate activities. They experience them as one continuous relationship with the business.
Customer journey mapping helps organizations connect these interactions and understand where the overall experience can improve.
A journey map provides a visual overview of how customers interact with a business.
It helps teams understand what customers are trying to accomplish, what information they need, and where they may experience confusion or frustration.
Customers may encounter problems such as complicated registration forms, unclear pricing, delayed responses, repetitive information requests, or difficult checkout procedures.
Mapping the journey helps businesses identify where these problems occur and investigate their underlying causes.
Customer experiences often involve multiple teams.
For example, a customer may interact with marketing before speaking to sales, then work with an onboarding specialist and eventually contact technical support.
A shared customer journey map helps these departments understand their responsibilities and how their activities affect the overall experience.
A visual journey map can highlight unnecessary steps, confusing interactions, communication gaps, and opportunities to simplify the customer experience.
Teams can use these findings to prioritize improvements based on customer needs and business objectives.
Customer journey maps provide a structured way to discuss customer interactions and potential improvements.
They help stakeholders move beyond isolated complaints or assumptions and evaluate the complete experience before deciding what should change.
Traditional customer journey mapping remains valuable because it encourages teams to understand customers through interviews, surveys, research, and collaborative workshops. However, maintaining accurate and comprehensive journey maps can present several challenges.
Traditional journey maps often rely on customer interviews, persona research, surveys, and stakeholder workshops. These methods provide valuable insights, but their accuracy depends on the quality, diversity, and frequency of the research.
If important customer segments or interactions are overlooked, the resulting map may not represent the complete experience.
Customer behavior changes as businesses introduce new products, features, communication channels, and services.
A journey map created several months ago may no longer reflect the current customer experience. Organizations therefore need to review and update their maps regularly.
Building a comprehensive journey map often requires input from product, marketing, sales, customer service, UX, and operations teams.
Combining these perspectives into one clear representation can take considerable coordination and discussion.
A business may serve individual consumers, small businesses, enterprise customers, and other specialized segments.
Each group may have different expectations, purchasing processes, communication preferences, and support requirements. Creating and maintaining separate journey maps for every segment can require significant effort.
AI-assisted diagramming can help teams organize information and generate initial visual representations more efficiently. However, customer research, stakeholder input, and regular validation remain essential.
Check out: How Product Managers Can Turn PRDs into Visual Workflows Instantly
AI supports customer journey mapping in several ways. Depending on the tools and data available, it can help organize customer information, analyze feedback, identify patterns, and generate visual diagrams.
It is important to distinguish between AI diagramming tools and more advanced customer analytics platforms. Not every diagramming tool automatically analyzes behavioral datasets or predicts customer actions.
Here are some of the ways AI can support the process.
Businesses collect customer interaction information from different sources, including website analytics, application usage records, support tickets, email engagement, surveys, and sales conversations.
AI can help organize this information into meaningful categories and identify touchpoints that teams should consider when creating a journey map.
For example, customer feedback may reveal that people frequently move from a product page to a pricing page before requesting a demo. This interaction can be included in the relevant journey stage.
The accuracy of the resulting map depends on the quality and completeness of the available information.
One of the most practical applications of AI diagramming is converting written journey descriptions into visual representations.
Users can describe customer actions, stages, touchpoints, and decision points in natural language. An AI diagramming tool can use this description to create an initial diagram.
Teams can then review the visual structure, correct missing steps, and refine the connections.
Customer feedback often contains useful information about expectations, frustrations, and satisfaction.
AI-powered language analysis can help categorize written feedback from surveys, reviews, and support conversations. For example, comments about complicated registration or delayed assistance may be grouped under relevant journey stages.
These findings can be added to a customer journey map to provide more context about the customer experience.
However, sentiment analysis should be treated as an aid rather than a definitive measure of how every customer feels. Results should be reviewed against actual customer feedback and other evidence.
Customers may interact with a business through websites, mobile applications, email, social media, phone calls, and physical locations.
AI-powered analytics systems can help organizations analyze interactions across different channels when the relevant data is available and can be connected appropriately.
A journey diagram can then represent how customers move between these touchpoints.
This is particularly useful for businesses that want to understand the relationship between digital and offline interactions.
Some advanced AI and customer analytics platforms use historical interaction data to identify patterns associated with purchasing decisions, customer engagement, or churn.
These insights can help businesses investigate which interactions may influence customer outcomes.
However, predictive journey modeling requires appropriate data, analytical capabilities, and validation. It should not be confused with the basic process of generating a diagram from a written description.
Also check: Why are Product Teams Replacing Manual Diagramming with AI?
AI-generated customer journey diagrams are visual representations of customer interactions created with the assistance of artificial intelligence.
Instead of manually drawing every stage, touchpoint, decision, and connection, users can describe a customer scenario in natural language and use an AI diagramming tool to generate an initial visual structure.
For example, a business might provide the following description:
"A customer discovers our SaaS product through Google, visits the website, compares pricing plans, signs up for a free trial, receives onboarding emails, explores the dashboard, contacts support if they encounter difficulties, and eventually upgrades to a paid subscription."
An AI diagramming tool can use this description to organize the journey into stages and connected activities.
The generated diagram can help teams visualize the sequence of interactions, review the customer journey, and identify areas that need more information or clarification.
Depending on the diagram structure and the information provided, a customer journey diagram can include:
The quality of the diagram depends on the quality of the information provided.
AI can organize and visualize a journey description, but it cannot automatically know what customers actually think, feel, or experience unless reliable research and customer information are provided.
In other words, AI helps turn customer journey information into a visual representation. Customer research and business knowledge provide the foundation for an accurate map.
Traditional customer journey mapping often involves workshops, interviews, research, and manual diagram creation.
AI-generated diagrams can accelerate the visualization process by converting written descriptions into initial diagrams.
Here is how the approaches compare:
| Area | Traditional Journey Mapping | AI-Generated Journey Diagrams |
|---|---|---|
| Information collection | Interviews, surveys, workshops, and research | Can use the same sources, with AI helping organize the information |
| Diagram creation | Manually arranged by teams | Initial diagrams generated from natural-language descriptions |
| Journey visualization | Created using diagramming software | AI assists with arranging stages, activities, and connections |
| Process refinement | Manual editing and stakeholder discussions | AI-assisted refinement and stakeholder review |
| Documentation | Often prepared separately | Can be connected with structured process documentation when supported by the tool |
| Validation | Customer research and stakeholder review | Still requires customer research and stakeholder review |
AI-generated diagrams can reduce the effort involved in creating the initial visual representation. However, they do not eliminate the need for customer interviews, feedback analysis, or business validation.
Read: Visual Thinking for Product Managers - How AI Diagrams Improve Decision-Making
AI can support different stages of customer journey mapping, from organizing information to generating visual diagrams and exploring possible improvements.
One of the most practical uses of AI diagramming is converting written customer journey descriptions into visual workflows.
For example, a product manager may describe the following experience:
"A visitor arrives at the website, explores the product page, requests a demo, receives a call from the sales team, evaluates the proposal, and signs a contract."
AI can help organize this information into a sequence of activities and interactions.
This makes it easier for stakeholders to understand the journey without reading lengthy process descriptions.
Customers interact with businesses through different channels.
A single purchasing journey may involve:
AI-generated diagrams can help organize these touchpoints into a connected visual structure.
This is particularly useful for businesses that want to understand how customers move between online and offline channels.
Not every customer follows the same journey.
Some visitors may purchase immediately, while others compare alternatives, request additional information, or leave without completing the purchase.
An AI-generated diagram can represent these different paths through decision points and branching connections.
For example:
Representing these paths helps businesses understand that customer journeys are not always linear.
When customer feedback, support records, survey responses, or other relevant information is available, AI can help organize recurring problems and associate them with specific journey stages.
For example, customer feedback may reveal repeated complaints about:
These observations can be added to a journey map to show where customers may experience friction.
The team should validate the findings against actual customer evidence rather than treating AI-generated assumptions as confirmed problems.
Businesses often serve multiple customer segments.
For example, a SaaS company may have:
Each group may follow a different journey.
AI diagramming can help teams create separate visual representations for different customer personas and compare their activities, touchpoints, decisions, and requirements.
This makes it easier to identify where experiences should be personalized or simplified.
A diagram is useful for understanding a customer journey, but teams may also need written documentation explaining each stage.
Depending on the AI platform, journey information can be organized into structured descriptions, process steps, responsibilities, and exception paths.
This helps stakeholders understand not only what appears in the diagram but also the activities and decisions behind it.
Creating a useful customer journey map requires more than entering a short prompt into an AI tool.
The most effective approach combines customer research, structured information, AI-assisted visualization, and stakeholder validation.
Here is a practical step-by-step process.
Start by selecting one specific customer journey.
Avoid attempting to map the entire customer lifecycle in one diagram, particularly if it involves multiple products, customer segments, and departments.
Instead, choose a clearly defined scenario, such as:
A clearly defined journey makes the resulting diagram easier to understand and validate.
A customer persona represents a particular type of customer with specific characteristics, goals, expectations, and challenges.
For example, a SaaS company may define a persona as:
Customer Persona: Small Business Owner
The journey of this customer may differ from that of an enterprise buyer who requires security reviews, procurement approvals, and technical evaluations.
Defining the persona helps ensure that the journey map represents a specific customer perspective.
Before generating the diagram, gather relevant information about the customer experience.
Useful sources include:
This information helps identify actual customer behaviors, expectations, questions, and pain points.
If customer data is incomplete, clearly distinguish confirmed information from assumptions that need further research.
Break the selected journey into meaningful stages.
For example, a SaaS subscription journey may include:
The number and names of stages should reflect the actual business model and customer experience.
For each stage, identify what the customer does and how the business interacts with them.
Consider the following questions:
For example:
| Journey Stage | Customer Action | Business Touchpoint |
|---|---|---|
| Awareness | Searches for a solution | Search engine and advertisements |
| Discovery | Explores product features | Website and product pages |
| Evaluation | Compares plans | Pricing page and demo |
| Registration | Creates an account | Sign-up form |
| Onboarding | Learns how to use the product | Emails and onboarding resources |
| Purchase | Selects a subscription | Checkout and payment system |
| Retention | Uses the product | Product experience and support |
This structured information becomes the foundation for generating the customer journey diagram.
Once the journey information is organized, provide it to an AI diagramming tool.
A useful prompt should clearly describe:
The AI tool can then convert the description into an initial visual representation.
Review the diagram for missing stages, confusing connections, unclear labels, and incorrect decision paths.
After generating the initial diagram, review each stage to identify possible friction points.
For example:
| Journey Stage | Potential Pain Point | Improvement Opportunity |
|---|---|---|
| Product discovery | Product information is difficult to understand | Improve product descriptions |
| Evaluation | Pricing is unclear | Provide transparent pricing |
| Registration | Sign-up form is too long | Simplify registration |
| Onboarding | Customers do not know where to start | Add guided onboarding |
| Purchase | Payment process is confusing | Improve checkout instructions |
| Support | Customers wait too long for assistance | Improve support workflows |
Use actual customer feedback and operational data wherever possible.
Share the generated diagram with the teams responsible for different parts of the customer experience.
For example:
Use their feedback to correct missing activities, refine decision paths, and improve the diagram's clarity.
Once the journey map has been reviewed, share it with relevant stakeholders.
A customer journey diagram can be used during:
The map should also be revisited when customer expectations, products, channels, or business processes change.
Also read: Key Considerations When Choosing an AI Diagramming Tool for Complex System Architectures
Consider a SaaS company that offers project management software to small and medium-sized businesses.
The company wants to understand how potential customers move from discovering the product to becoming paying subscribers.
Its existing customer experience includes several stages, but the marketing, sales, product, and support teams manage these interactions separately.
The company decides to create a customer journey map to bring the entire experience together.
Name: Alex
Profile: Small business owner managing a team of 15 employees.
Goals:
Challenges:
The customer journey begins when Alex searches for project management software.
Stage 1: Awareness
Alex searches Google for project management tools and discovers the company's website.
Touchpoints: Search engine results, advertisements, blog articles.
Stage 2: Product Discovery
Alex visits the website, explores product features, and reads customer testimonials.
Touchpoints: Product pages, feature descriptions, customer reviews.
Stage 3: Evaluation
Alex compares pricing plans and explores available features.
Touchpoints: Pricing page, product comparison, demo request form.
Stage 4: Registration
Alex signs up for a free trial and creates an account.
Touchpoints: Registration form, verification email, account setup.
Stage 5: Onboarding
Alex explores the dashboard, creates the first project, and invites team members.
Touchpoints: Product dashboard, onboarding emails, tutorials.
Stage 6: Purchase
After evaluating the product, Alex selects a paid subscription.
Touchpoints: Pricing selection, checkout, payment confirmation.
Stage 7: Retention
Alex continues using the product and contacts support when assistance is needed.
Touchpoints: Product experience, help center, customer support.
The company can provide this journey description to an AI diagramming tool and generate an initial visual representation.
The diagram can show:
Once generated, the marketing, sales, product, and support teams can review the diagram and add information from their respective areas.
During the review, the company discovers several potential issues:
The company can prioritize these issues and develop improvements.
For example, it may simplify pricing explanations, introduce a guided setup experience, improve onboarding emails, and make support resources more accessible.
The journey map provides a shared visual reference for these improvements.
Different AI technologies can support different aspects of customer journey mapping. Some help analyze customer interaction data, while others assist with understanding written feedback or generating visual diagrams.
Not every AI diagramming tool includes all these capabilities. Understanding the differences helps organizations choose appropriate tools and set realistic expectations.
Process mining uses event data from business systems to understand how processes actually operate.
Applied to customer interactions, it can help organizations examine sequences of events, identify common paths, and discover variations or bottlenecks.
For example, an e-commerce company may analyze order events to understand where customers abandon the purchasing process.
The resulting insights can help teams identify which interactions should be represented in a customer journey map.
Large Language Models can interpret and generate natural-language content.
In customer journey mapping, they can help summarize customer feedback, organize written descriptions, identify activities, and generate initial diagram structures.
They can also make complex process information easier for nontechnical stakeholders to understand.
Graph-based approaches represent relationships between entities, interactions, and events.
For customer journey analysis, these methods can help explore connections between customer touchpoints, channels, and outcomes when appropriate data is available.
They are particularly relevant to complex journeys involving multiple channels and interconnected interactions.
Computer vision and session analysis technologies can help organizations understand how users interact with digital interfaces.
Depending on the tools used, businesses may analyze interface recordings, navigation patterns, or visual interaction data to investigate usability problems.
These findings can help teams identify potential friction points and improve the relevant stages of a customer journey.
Machine learning models can analyze historical customer interaction data to identify patterns associated with customer engagement, conversion, or churn.
For example, a subscription business may use predictive analytics to identify customer behavior associated with a higher likelihood of cancellation.
Such analysis requires suitable data, appropriate models, and validation. It is a specialized analytics capability rather than a standard feature of every AI diagramming platform.
Different customer journey diagrams serve different purposes. The right format depends on the journey's complexity, the audience, and the information the business wants to communicate.
A customer journey map presents the customer's experience across different stages, including actions, touchpoints, expectations, and pain points.
It is useful for understanding the overall customer experience and identifying opportunities for improvement.
A customer experience flowchart illustrates the sequence of interactions between a customer and a business.
It can include activities, decisions, alternative paths, and outcomes.
For example, an e-commerce checkout flowchart may show what happens when a customer adds a product to the cart, enters shipping details, selects a payment method, and completes or abandons checkout.
Swimlane diagrams organize activities into separate lanes based on the people, teams, or systems involved.
For example, a customer onboarding journey may include separate lanes for:
This format helps stakeholders understand responsibilities, handoffs, and potential gaps between departments.
A service blueprint provides a more detailed view of how a customer-facing experience connects with internal business operations.
It may include:
Service blueprints are particularly useful when a customer experience depends on several departments and internal systems.
Customer onboarding diagrams illustrate the steps customers follow after purchasing or registering for a product or service.
They may include account setup, verification, product configuration, training, support interactions, and activation milestones.
Customer support journey diagrams represent how customers seek help, submit requests, interact with support teams, receive solutions, and provide feedback.
They can help organizations understand escalation paths and identify opportunities to improve service delivery.
Omnichannel diagrams illustrate how customers move between different communication and purchasing channels.
For example, a customer may discover a product through social media, research it on a website, visit a physical store, and complete the purchase through a mobile application.
These diagrams help businesses understand the relationship between digital and offline interactions.
Check: Top 5 Free AI Diagram Generators to Instantly Visualise Your Ideas
AI-generated diagrams can make customer journey visualization more accessible and help teams communicate complex experiences more effectively.
Creating detailed diagrams manually can require time and diagramming expertise.
AI diagramming tools can convert structured descriptions into initial visual representations, reducing the effort involved in arranging stages, activities, and connections.
Customer journeys may involve multiple channels, departments, and decision paths.
Visual diagrams help teams understand how these interactions connect and where customers move between different stages.
Marketing, sales, product, and customer support teams may have different perspectives on the customer experience.
A shared diagram gives stakeholders a common reference for discussions, reviews, and planning.
Visualizing a customer journey can help teams notice gaps in the experience.
For example, a journey map may reveal that there is no clear communication after registration or that customers are not informed about the next step after requesting a demo.
AI-generated diagrams provide a useful starting point for these discussions.
Customer journey diagrams can become part of internal documentation, product planning, customer experience guidelines, and process improvement initiatives.
When supported by the platform, diagrams can also be accompanied by structured written documentation.
Not every stakeholder is comfortable interpreting lengthy written process descriptions.
Diagrams make it easier to explain customer interactions, decisions, and responsibilities to both technical and nontechnical audiences.
Customer journeys change as businesses introduce new channels, products, services, and customer support processes.
Updating the underlying journey description and regenerating or refining the diagram can help teams maintain more useful documentation.
AI can simplify diagram creation, but the quality of the final journey map depends on how well the information is structured and validated.
Here are some practical recommendations.
Do not try to represent every possible customer interaction in one diagram.
Start with a clearly defined scenario, such as first-time registration, product purchase, customer onboarding, or support resolution.
Base the journey map on customer interviews, surveys, website analytics, support records, and other relevant information.
Avoid treating assumptions about customer behavior as confirmed facts.
Identify the type of customer whose journey you want to represent.
Different customer groups may have different goals, expectations, decision-making processes, and preferred channels.
Document the channels through which customers interact with your business.
Consider websites, mobile applications, emails, social media, sales teams, customer support, and physical interactions where relevant.
Customer journeys are rarely completely linear.
Represent important decisions, abandoned journeys, support requests, alternative purchasing paths, and other exceptions.
Avoid overcrowding a diagram with too much information.
Use clear labels, logical connections, and meaningful groupings. If a journey becomes too complex, divide it into smaller diagrams.
Review the diagram with people who understand the customer experience.
Confirm that the stages, touchpoints, activities, and decision paths accurately represent the intended journey.
Clearly identify which journey details come from customer research and which are hypotheses that require further validation.
This prevents teams from making decisions based on unsupported AI-generated assumptions.
Review customer journey maps whenever important changes occur in products, services, communication channels, or internal processes.
A journey map should remain useful as the customer experience evolves.
Choosing an AI diagramming tool requires understanding what your team needs to create and how the resulting diagrams will be used.
Here are some important factors to consider.
Look for tools that allow users to describe processes and workflows in plain language.
This can make diagram creation more accessible to business users who may not have technical diagramming experience.
Check whether the tool supports the diagram formats relevant to your requirements, such as flowcharts, process diagrams, decision-based workflows, and other visual representations.
The ability to represent different activities and branching paths is particularly useful for complex customer journeys.
AI-generated diagrams should be treated as initial drafts.
Look for options that allow users to review, modify, and refine diagrams as business requirements change.
Some teams need more than a visual representation.
If your organization requires supporting process documentation, check whether the platform can generate written descriptions, procedures, or other documentation alongside diagrams.
Consider how diagrams will be used across your organization.
Check whether the tool supports the required export formats and sharing options so stakeholders can review and use the diagrams.
Customer information may contain personal or confidential details.
Before using any AI tool with customer data, review its security and privacy policies. Follow organizational data-handling requirements, avoid sharing unnecessary personal information, and use approved environments.
Although AI-generated diagrams can make visualization easier, certain mistakes can reduce their usefulness.
Mapping the business process instead of the customer experience: Internal activities are important, but a customer journey map should primarily represent what the customer does, needs, experiences, and expects.
Using assumptions instead of customer research: AI can generate a plausible journey, but plausibility does not prove accuracy. Validate important findings through customer feedback and operational evidence.
Trying to include every interaction in one diagram: Overly detailed diagrams can become difficult to read. Break complex journeys into smaller, connected maps.
Ignoring different customer personas: A journey that works for one customer segment may not represent the experience of another.
Focusing only on digital touchpoints: Depending on the business, phone calls, in-person interactions, physical locations, and offline processes may also influence the customer experience.
Treating the AI-generated diagram as final: AI-generated diagrams should be reviewed for missing activities, incorrect connections, unclear decisions, and incomplete information before being shared as official documentation.
Ignoring data privacy: Customer information may contain personal or confidential details. Use approved AI environments and follow applicable privacy and data-handling policies when preparing prompts and source material.
Turning customer journey descriptions into clear visual diagrams can take time, especially when a journey includes multiple stages, decisions, alternative paths, and business interactions.
FlowcastGPT helps simplify the diagram creation process by allowing users to describe ideas and workflows in natural language and generate visual diagrams with AI.
Instead of manually arranging every shape and connection, teams can start with a written description of the customer journey and use AI to create an initial visual representation.
Describe the customer journey in plain language, including its stages, activities, and important decision points.
FlowcastGPT can transform the description into a visual diagram that helps stakeholders understand how the journey is structured.
Customer journeys often involve different outcomes.
For example, a customer may complete a purchase, request additional information, abandon the checkout process, or contact customer support.
FlowcastGPT supports process diagrams with decision points and labelled paths, helping teams represent branching workflows more clearly.
Customer journey diagrams can benefit from supporting documentation that explains the activities and responsibilities behind each stage.
FlowcastGPT can generate a visual process diagram and a structured Standard Operating Procedure (SOP) from a single process description.
The generated documentation can include process purpose, scope, roles, numbered steps, and exceptions.
This helps teams maintain a clearer connection between the visual representation and its written explanation.
For teams that need to take a process beyond documentation, FlowcastGPT can also generate code scaffolds from the same process description.
This provides a starting point for developers who need to translate defined process logic into software implementation.
The generated scaffold should be reviewed, tested, and extended by developers before it is used in a production application.
Generated diagrams can be saved, exported, and shared with colleagues, depending on the available platform features.
This makes it easier to review customer journey structures during planning meetings, product discussions, stakeholder reviews, and internal documentation activities.
With FlowcastGPT, teams can move from written process descriptions to visual diagrams and supporting documentation through an AI-assisted workflow.
Explore FlowcastGPT and turn your customer journey ideas into clear visual representations.
Customer journey mapping is the process of visually representing the stages, interactions, touchpoints, and experiences a customer goes through when engaging with a business, product, or service. It helps organizations understand customer behavior, identify pain points, and improve the overall experience.
AI can help organize written customer journey descriptions, identify activities and decision points, and generate initial visual diagrams. It can also help summarize customer feedback and structure information from research. Customer data and stakeholder validation are still necessary to ensure the journey map is accurate.
Yes. AI diagramming tools can convert natural-language descriptions into visual representations of customer journeys. Users can describe customer actions, journey stages, touchpoints, and decision paths to generate an initial diagram that can then be reviewed and refined.
Useful information includes customer personas, goals, journey stages, actions, touchpoints, communication channels, customer feedback, pain points, and business interactions. Customer interviews, surveys, website analytics, CRM records, and support tickets can provide valuable inputs.
A customer journey map focuses primarily on the customer's experience, including actions, touchpoints, expectations, and pain points. A service blueprint goes further by showing the internal activities, employees, systems, and supporting processes responsible for delivering that experience.
Marketing, sales, product management, customer experience, customer success, customer support, and business operations teams can all use customer journey diagrams. They provide a shared visual reference for understanding and improving customer interactions.
Yes. Customer journeys often involve different choices and outcomes. A journey map can include decision points, alternative paths, abandoned journeys, support interactions, and other possible customer actions.
Businesses should review their journey maps whenever there are significant changes to products, services, customer expectations, communication channels, or internal processes. Periodic reviews also help ensure that the maps remain aligned with actual customer experiences.
AI-generated diagrams can reduce manual diagram creation effort, improve visual communication, make complex journeys easier to understand, and support collaboration between teams. They also provide a structured starting point for identifying missing steps and reviewing customer experience improvements.
FlowcastGPT is an AI-powered diagramming platform that converts natural-language descriptions into visual diagrams. Teams can describe customer journeys, activities, and decision paths to generate initial process diagrams and refine them for documentation and communication.
Customer journey mapping helps businesses understand how people interact with their products, services, and communication channels. It brings different touchpoints together and provides a clearer picture of the customer experience.
AI-generated diagrams make this process more accessible by transforming written descriptions into visual representations. They help teams organize journey stages, represent decisions, communicate complex interactions, and collaborate on potential improvements.
However, an effective customer journey map must be grounded in real customer research. AI can help structure and visualize the information, but businesses still need customer feedback, operational evidence, and stakeholder validation to ensure the map reflects actual experiences.
By combining customer research with AI-assisted diagramming, organizations can create clearer journey maps and make more informed customer experience decisions.
Whether you are mapping a purchasing journey, customer onboarding experience, subscription lifecycle, or support process, FlowcastGPT helps turn written process descriptions into visual diagrams and supporting documentation.