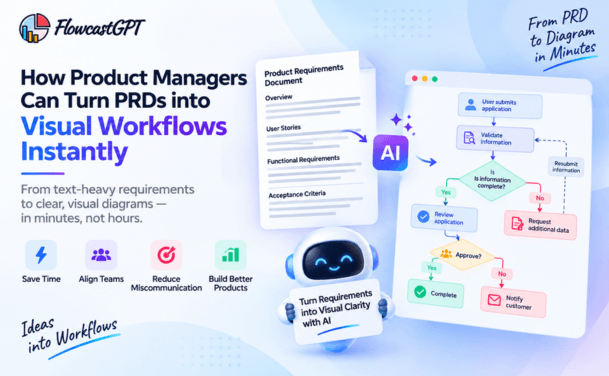
Your VP walks in at 9 AM and asks for something visual to anchor a 10 AM cross-functional meeting. You have a fifteen-page Product Requirements Document. You have one hour.
Every product manager has been in this moment. And every product manager knows the same uncomfortable truth: a PRD — no matter how well-written — is not a diagram. It is a dense, text-heavy document that engineers understand, designers interpret differently, and business stakeholders often do not read at all.
The translation layer between what is written in a PRD and what stakeholders can actually discuss, align on, and act from is almost always visual. User flow diagrams. Process maps. Sequence diagrams for API interactions. Feature dependency charts. State machine diagrams for complex logic. These are the artifacts that make a PRD real to everyone who was not in the room when it was written.
The problem is that creating these visuals has historically taken hours. Open a diagramming tool. Drag components onto a canvas. Connect them with arrows. Label everything. Realize the flow is wrong and start over. Export. Paste into Confluence. Repeat when the PRD changes.
That process is over.
73% of product managers now use AI weekly, and 96% report using it consistently, according to ProductPlan's 2026 State of Product Management report. Productboard's October 2025 survey of enterprise product teams found 100% of teams using AI tools, with an average of four hours saved per task and 33 hours saved across core PM functions. The savings concentrate specifically in the assembly-heavy work: PRD drafting, flow mapping, and documentation.
AI diagram generation from natural language text is the capability that collapses the gap between "we wrote the PRD" and "we can show stakeholders exactly what we are building."
This guide covers the five categories of visual workflows PMs extract from PRDs most frequently, the prompts that produce accurate results, and how to build a repeatable PRD-to-diagram workflow that takes minutes rather than hours.
Read: FlowcastGPT New Features - Generate Process Documents & Code Scaffolding with AI Capabilities
Before the how, the why.
PRDs are written for completeness. Diagrams are built for alignment.
A PRD must capture every requirement, every edge case, every acceptance criterion. That completeness is what makes it a useful engineering specification. It is also what makes it impenetrable for a first-read from a stakeholder whose primary question is: "How does this actually work for a user?"
A user flow diagram answers that question in fifteen seconds. A sequence diagram answers "how does the system handle this?" in thirty. A process map answers "what does the team need to do?" in a glance.
Visual workflows do three things that text requirements do not:
Surface missing logic. The act of drawing a flow frequently reveals gaps — states that have no exit path, conditional branches that lead nowhere, error scenarios the PRD documented but did not map. A 2026 Harvard Business Review study on PM effectiveness found that the skills of defining problems and evaluating solutions are what make AI adoption successful for PMs — and diagramming a flow from a PRD is precisely that: evaluating the solution by making it visible.
Accelerate cross-functional review. Engineers, designers, QA, and business stakeholders can all review a diagram in a shared meeting with shared understanding. The same conversation over a PRD document takes three times as long and produces less alignment, because each function reads a document through the lens of its own domain.
Create living documentation. A diagram embedded in Confluence, Notion, or a Jira ticket is the documentation artifact people actually reference during development. Figr's 2026 analysis of PM productivity found that AI cuts concept and UX development time from two weeks to half a day when the tool generates flows directly from context — because the diagram becomes the specification rather than an artifact derived from it.
Also read: How AI Can Automatically Generate Sequence Diagrams from Text
A well-structured PRD contains the raw material for multiple diagram types. The key is knowing which section of the PRD maps to which diagram type — and prompting accordingly.
What they show: The path a user takes through a product to complete a specific goal — from entry point through each decision and action to the final outcome.
Which PRD section to use: The "User Stories" section, the "Use Cases" section, or any section that describes the step-by-step experience from the user's perspective.
Why they matter: User flows make it immediately clear to designers and engineers which screens must exist, which transitions must work, and where users can get stuck or lost.
How to prompt:
"Generate a user flow diagram for the following user story: [paste the user story section from your PRD]. Show each step the user takes, the decisions they make, the actions they perform, and the outcomes at each branch. Include error paths and empty states."
What good output looks like: A diagram with a clear start node, sequential action steps, decision diamonds with Yes/No branches, success endpoints, and error paths — covering the full range of outcomes the PRD describes.
Common gap the diagram reveals: PRDs often document the happy path in detail and mention edge cases only briefly. When you generate the user flow, missing branches become visually obvious — there is literally no arrow leading out of the decision node.
What they show: The sequence of steps and decisions within a business process — who does what, in what order, and what triggers the next step.
Which PRD section to use: Any section describing a multi-step operational workflow, approval process, or cross-team handoff. Common in PRDs for internal tools, back-office applications, and enterprise software.
Why they matter: Process flows clarify the cross-functional coordination required to deliver a feature — who the process depends on, where the handoffs occur, and which steps can run in parallel versus must run in sequence.
How to prompt:
"Create a process flow diagram from the following workflow description in our PRD: [paste the relevant section]. Include each step, the role or system responsible for each step, the decision points, the trigger conditions, and the expected outcomes. Show parallel processes where they exist."
Pro tip: For multi-party processes, add swimlanes to the prompt: "Organize the diagram with swimlanes for each role: [list roles from your PRD]." FlowcastGPT will separate each participant's steps into horizontal lanes, making handoffs visible at a glance.
What they show: The time-ordered sequence of messages between systems, services, APIs, and users — who sends what to whom, in what order, with what responses.
Which PRD section to use: The "Technical Requirements," "Integration Requirements," or "API Behavior" sections — any section describing how the product interacts with external services, microservices, or internal APIs.
Why they matter: Sequence diagrams are the primary tool engineers use to validate that a product's described behavior is architecturally achievable. A PM who provides a sequence diagram with the PRD reduces back-and-forth in technical review by making the system interaction model explicit rather than implied.
How to prompt:
"Generate a sequence diagram from the following API integration requirement: [paste the technical section from your PRD]. Identify each system participant, show the message flow in time order, indicate synchronous and asynchronous calls, and show the response paths including error handling."
What this produces: A Mermaid.js or PlantUML sequence diagram with named participants, labeled arrows showing each request and response, conditional blocks for error paths, and activation bars showing when each system is processing.
What they show: Which features depend on other features being built first, and the order in which work must be delivered to avoid blocking downstream development.
Which PRD section to use: The "Scope," "Out of Scope," "Milestones," or "Dependencies" sections — or any section that describes the phased rollout of functionality.
Why they matter: Feature dependency diagrams are the planning artifacts that engineers and project managers use to sequence work correctly. Without them, teams discover blocking dependencies during development — after the sprint has already been committed.
How to prompt:
"Create a feature dependency diagram from the following milestone and scope section of our PRD: [paste the section]. Show each feature as a node, draw arrows from features that must be completed before dependent features can begin, and group by release phase where phases are defined."
Common gap the diagram reveals: Circular dependencies — Feature A requiring Feature B, which requires Feature A — that are invisible in prose but immediately obvious as a loop in a dependency graph.
What they show: All the possible states a system, object, or user can be in — and the events or conditions that trigger transitions between states.
Which PRD section to use: Any section describing how an object's status changes over time — subscription lifecycle, order status, account state, approval workflow state, content moderation state.
Why they matter: State machine diagrams make complex business logic explicit in a format that engineers can implement directly and QA teams can use to build comprehensive test cases. Every transition in the diagram is a test case.
How to prompt:
"Generate a state machine diagram from the following status lifecycle described in our PRD: [paste the relevant section]. Show each possible state as a node, label each transition with the event or condition that triggers it, include entry and exit states, and show any parallel states if described."
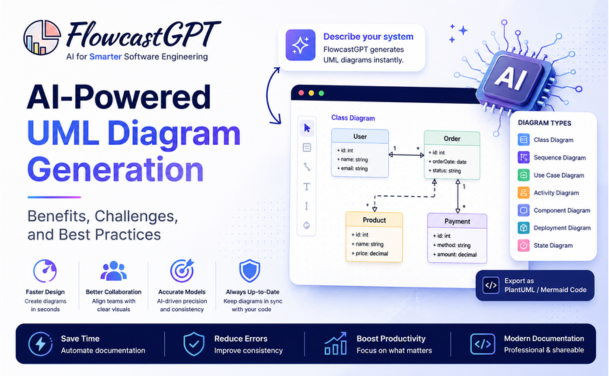
Check: AI-Powered UML Diagram Generation - Benefits, Challenges & Best Practices
Building a systematic approach — not just a one-off prompt — is what separates PMs who use AI tools for occasional tasks from PMs whose entire documentation workflow runs faster.
Before prompting anything, read through the PRD and mark which sections contain:
A single PRD for a moderately complex feature typically contains enough material for three to five distinct diagrams.
Copy the specific PRD section you want to diagram. Remove internal comments, placeholders, and editor notes that were not meant for the final document. The cleaner the input, the more accurate the diagram.
Do not paste the entire PRD and ask for "a diagram." Specify the diagram type, the participants or actors, the level of detail required, and the intended audience. A diagram for an engineering review needs different granularity than a diagram for an executive presentation.
The first diagram is the draft. Follow-up prompts refine it: "Add a notification step after the payment confirmation," "Split the decision at step 3 into two branches — one for free users and one for paid users," or "Simplify this to show only the happy path — I need a version for the exec deck."
This four-step process consistently produces a complete set of visual workflow artifacts from a PRD in under 30 minutes — the work that previously required a full afternoon.
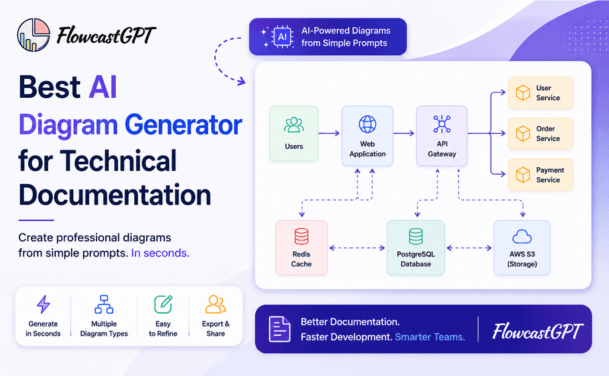
Also check: Best AI Diagram Generator for Technical Documentation in 2026
An AI-powered workflow can be significantly simpler.
The product manager provides the requirements document or relevant portion of the PRD.
The input could contain:
FlowcastGPT supports working from requirements documents, notes, specifications, and existing process write-ups.
The AI analyzes the requirements and identifies potential:
For example:
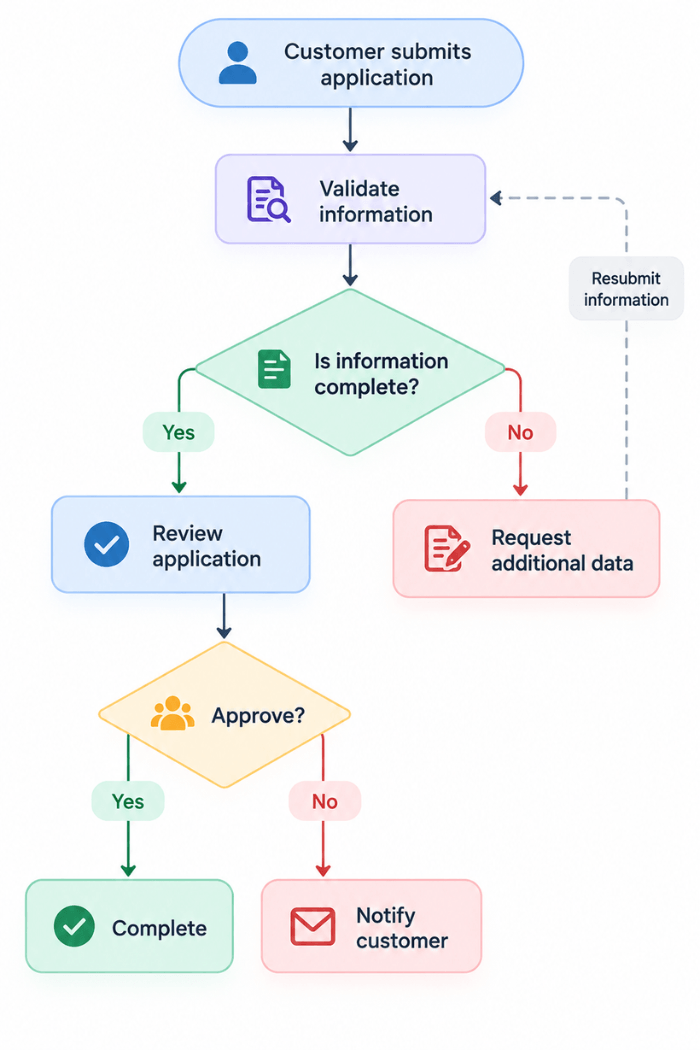
Instead of manually creating each shape, the product manager starts with the requirements.
The AI converts the identified logic into a diagram.
FlowcastGPT's current diagram-generation capabilities include process diagrams with start/end nodes, process steps, decision points, multi-branch paths, and labeled conditions.
The result becomes a visual representation of the requirements.
AI-generated diagrams should be treated as a first draft, not automatically as the final source of truth.
The product manager should check:
This review remains an important part of product management.
Once reviewed, the visual workflow can become part of:
Read: How to Create System Architecture Diagrams Using AI
A PRD does not necessarily translate into only one diagram.
Depending on the requirements, a product manager may need several visual representations.
Useful for understanding how users interact with a product.
Example:
Login → Dashboard → Search → Product → Checkout → Confirmation
Useful for business and operational processes.
Example:
Request → Review → Approval → Fulfillment → Completion
Useful when business rules contain multiple conditions.
Example:
Is customer eligible?
→ Yes → Continue
→ No → Reject
Useful for showing how applications or services interact.
Example:
User → Web App → API → Service → Database
Useful for documenting what happens when the primary process does not succeed.
Example:
Payment → Failed → Retry → Alternative Payment Method → Support
AI diagramming can help product teams generate these visual representations from the same underlying requirements.
Also read: Creating SOPs Faster Using AI-Generated Flowcharts
The biggest benefit isn't simply creating a diagram faster.
The real value comes from using visual workflows throughout the product lifecycle.
Product managers can use workflows to visualize:
This can help transform qualitative observations into structured process models.
A workflow can help validate whether the PRD describes a complete process.
For example:
Requirement → Workflow → Missing Branch → New Requirement
The diagram becomes a tool for discovering gaps.
UX and product teams can use visual flows to establish:
This gives designers a clearer structural foundation before moving into detailed interface design.
Developers can use workflows to understand:
FlowcastGPT also now supports generating a code scaffold alongside a visual process diagram and structured SOP from a single process description, with the outputs sharing the same underlying process model.
Visual workflows can become a foundation for test planning.
For example:
| Workflow Path | Potential Test |
|---|---|
| Successful payment | Verify order creation |
| Failed payment | Verify retry behavior |
| Invalid card | Verify error handling |
| Out-of-stock item | Verify notification |
| Session timeout | Verify recovery |
| Cancelled checkout | Verify cart behavior |
This can help QA teams identify both the happy path and alternative paths.
Instead of walking stakeholders through every paragraph of a PRD, product managers can use the visual workflow as an entry point.
The team can discuss:
This makes requirements conversations more concrete.
Trying to diagram the whole PRD at once. One prompt, one diagram. A large PRD produces a large, unreadable diagram if processed as a single input. Diagram one user story, one process, one API interaction at a time.
Forgetting the error paths. Prompts that do not explicitly request error cases produce happy-path-only diagrams. Every user flow prompt should include: "Include error paths, empty states, and fallback behavior as described in the PRD."
Not specifying the audience. A sequence diagram for engineers needs participant names, message labels, and response codes. A process flow for a business stakeholder needs role names, plain-language step descriptions, and outcome labels. Specify the audience in the prompt.
Treating the first output as final. AI-generated diagrams from PRD text are accurate starting points — not finished documents. The PM who reviews the diagram against the PRD and iterates through two or three follow-up refinements produces something reviewable in a cross-functional meeting. The PM who pastes the first output directly into Confluence and moves on produces something that will generate confusion in that meeting.
Check: AI Workflow Visualization for Digital Transformation Projects - Complete Guide
The traditional product workflow has often looked like this:
Idea → PRD → Design → Development → QA
AI-assisted workflows are increasingly introducing another layer:
Idea → PRD → Visual Workflow → Design → Development → QA
The visual workflow acts as a bridge between written requirements and implementation.
And the next evolution is broader than diagram generation alone.
Instead of creating a diagram as an isolated artifact, teams can use a shared process model to generate multiple outputs.
For example:
Natural-language requirements ↓ Visual workflow ↓ Process documentation ↓ Code scaffold ↓ Implementation
This approach reduces repeated translation between teams and artifacts.
FlowcastGPT's current product capabilities reflect this direction: a single process description can produce a visual diagram, structured SOP, and code scaffold while keeping those outputs aligned through a shared process model.
For product managers, the biggest advantage of AI diagramming is not simply drawing boxes faster.
It is reducing the distance between what the product team wrote and what the team can see.
With FlowcastGPT, teams can work from requirements documents, notes, specifications, and process descriptions to create visual representations of workflows. The platform is designed to generate process diagrams with structured steps, decisions, branches, and labeled paths.
This can help product managers:
For teams that frequently move between PRDs, workflows, SOPs, and implementation planning, this can make the documentation process considerably more connected.
A PRD-to-visual workflow is the process of converting the text content of a Product Requirements Document into one or more visual diagram types — user flows, process maps, sequence diagrams, dependency charts, or state machine diagrams — that make the documented requirements understandable and reviewable for cross-functional stakeholders including engineering, design, QA, and business leadership.
Yes, with the right prompting approach. AI diagram generation from PRD text is most accurate when the source section is clean and specific, the diagram type is explicitly named, the actors and systems are identified, and edge cases are explicitly requested. PRDs that are vague or use inconsistent terminology produce less accurate initial diagrams, but iterative refinement through follow-up prompts consistently produces accurate results within two to three rounds of refinement.
The five most commonly used are user flow diagrams (from user stories), process flow diagrams (from operational workflow descriptions), sequence diagrams (from API and system integration requirements), feature dependency diagrams (from milestone and scope sections), and state machine diagrams (from status lifecycle descriptions). Most PRDs for complex features contain material for three to five of these simultaneously.
With a clean PRD section and a well-structured prompt, an initial diagram generates in under 30 seconds. A complete set of visual artifacts for a moderately complex feature — including initial generation and two to three rounds of refinement — typically takes 20 to 30 minutes. This compares to two to four hours for the equivalent manual diagramming work in a traditional drag-and-drop tool.
The fifteen-page PRD sitting in Confluence is not the artifact that will get your feature built correctly. The user flow diagram embedded on page two, the sequence diagram attached to the API requirements ticket, and the process map shared in the pre-sprint refinement meeting are the artifacts that will.
FlowcastGPT converts natural language descriptions into professional, editable diagrams — user flows, sequence diagrams, process flows, dependency maps, and state machines — in seconds. Paste the relevant section of your PRD, describe the diagram you need, and iterate until the visual matches the requirement.
The next time your VP asks for something visual to anchor tomorrow's meeting, you will have it in the time it takes to copy and paste.