Every major digital transformation project shares a common failure mode. It is not a technology failure. It is a visibility failure.
The technology gets selected, the budget gets approved, the implementation team gets started — and somewhere between the executive strategy and the operational deployment, the organization loses a clear shared understanding of how the transformed process is supposed to work. Different stakeholders have different mental models. Different teams are implementing different interpretations of the same requirement. The project that was supposed to eliminate silos creates new ones between the people who understand the technical implementation and the people who need to govern it.
Organizations are no longer asking whether AI is useful. They are asking where it delivers measurable ROI, how it improves workflow visibility, whether it can support compliance, and how well it connects with ERP, CRM, HRMS, finance, procurement, and IT systems.
Workflow visibility is in that list alongside ROI and compliance — because without it, you cannot demonstrate the other two.
Technology delivers only about 20% of an initiative's value. The other 80% comes from redesigning work — so agents can handle routine tasks and people can focus on what truly drives impact.
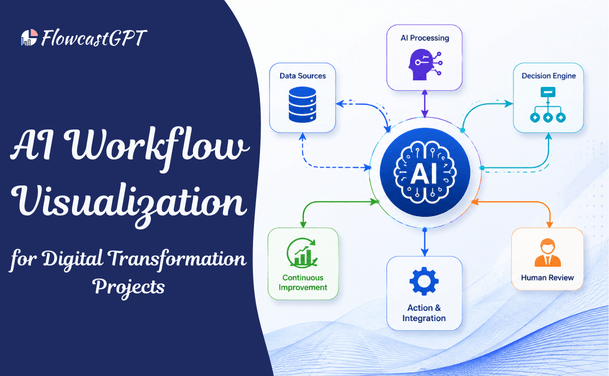
That work redesign — the 80% that determines whether a digital transformation project succeeds — requires that everyone involved can see how the work is designed. AI workflow visualization is what makes that design visible. This guide covers what it is, why it matters specifically for digital transformation, the tools and techniques available in 2026, and how leading organizations are using it to close the gap between ambitious transformation roadmaps and measurable operational outcomes.
The Definition
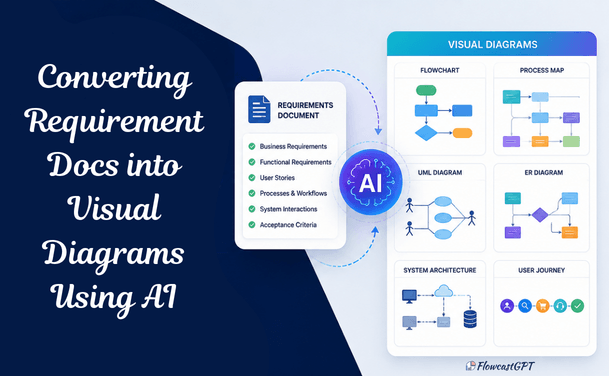
AI workflow visualization is the use of artificial intelligence to automatically create, maintain, and optimize visual representations of business processes. Unlike traditional process mapping — which required dedicated business analysts to manually interview stakeholders, draw diagrams in specialized tools, and maintain those diagrams through endless revision cycles — AI workflow visualization generates visual process maps from inputs that already exist: plain-language descriptions, requirements documents, meeting notes, existing process code, or conversational prompts.
The output is a structured, editable visual workflow — a flowchart, swimlane diagram, process map, or BPMN diagram — that accurately represents the intended process design and can be updated as the design evolves.
Traditional process mapping in digital transformation projects has three well-documented problems:
Speed mismatch: Digital transformation projects move at technology speed. Traditional process documentation moves at consulting speed. By the time a process map is produced, reviewed, revised, and approved, the technical implementation it was meant to document has already evolved. Stakeholders are making decisions based on diagrams that do not accurately reflect the current design.
Accessibility gap: Process maps produced by specialists for specialists — dense BPMN diagrams, complex swimlane flows — are inaccessible to the business stakeholders who need to validate that the mapped process reflects how the business should actually work. The map exists, but it does not create the shared understanding it was designed to produce.
Maintenance failure: In a digital transformation project with frequent scope changes, any diagram that requires manual updating will not be updated. Outdated process documentation is often worse than no documentation — it creates false confidence in a process design that has already changed.
AI workflow visualization addresses all three problems simultaneously: it generates visual representations at the speed of the design conversation, produces outputs in formats that business stakeholders can read without training, and enables fast regeneration when processes evolve.
Depending on the tool and the input, AI workflow visualization generates:
Process flowcharts: Sequential diagrams showing the steps in a workflow with decision branches and outcomes — the most universally readable format for cross-functional stakeholders.
Swimlane diagrams: Cross-functional process maps showing which team or system is responsible for each step, making handoffs and accountability visible at a glance.
BPMN process models: Business Process Model and Notation diagrams for technical and compliance audiences that require formal process specification.
UML sequence diagrams: Technical interaction diagrams showing how systems and actors communicate during a process — essential for systems integration design in digital transformation.
State machine diagrams: Visual representations of how key business objects (orders, applications, subscriptions) transition through lifecycle states — particularly valuable for workflow governance and exception handling design.
Data flow maps: Visualizations of how data moves through the transformed process — between systems, teams, and organizational boundaries — critical for data governance and compliance documentation.
Read: How to Convert Requirements Documents into Visual Diagrams Using AI
Many digital transformation projects struggle because teams have different interpretations of business requirements.
Business users understand the process.
Developers understand the technology.
Project managers focus on delivery.
Executives focus on outcomes.
Without a common visual language, misunderstandings often lead to delays, budget overruns, and rework.
AI workflow visualization bridges these gaps by providing a single source of truth that everyone can understand.
Visual workflows improve communication between:
This shared understanding significantly improves project success rates.
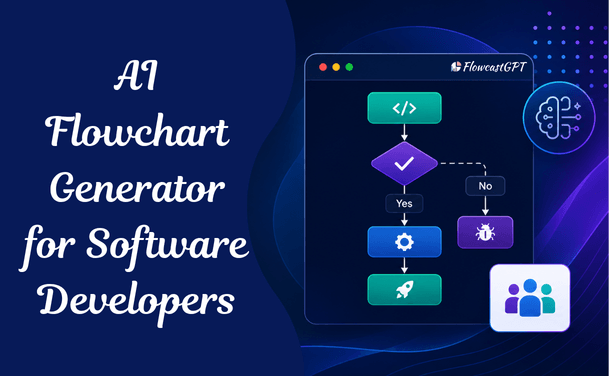
Also read: AI Flowchart Generator for Software Development Teams: A Complete Guide
Before a digital transformation project can be designed, the current state of the processes it will transform must be understood. AI-powered process mining — which analyzes system event logs, transaction records, and activity data to reconstruct the actual process flow — produces visual representations of how processes currently operate, not how they were supposed to operate.
The gap between the documented process and the actual process is frequently the most important finding in a digital transformation discovery phase. AI process mining surfaces that gap visually, showing:
This discovery visualization becomes the baseline against which the transformed process is designed — and against which post-transformation ROI is measured.
With the current state mapped, the design of the transformed state requires a visual workspace where process designers, technology architects, business stakeholders, and AI specialists can collaborate on what the new process should look like.
As you design a new agentic workflow, map it step-by-step, specifying where agents own the work, where people do, where people and agents collaborate, and how oversight can take place for each step.
This step-by-step mapping is the design output of the future state visualization phase. For each step in the transformed process:
Documenting these design decisions visually — in a swimlane diagram that shows AI agents and human roles side by side with clear handoffs between them — produces the design artifact that all subsequent implementation work references.
Organizations are no longer asking whether AI is useful. They are asking where it delivers measurable ROI, how it improves workflow visibility, whether it can support compliance, and how well it connects with ERP, CRM, HRMS, finance, procurement, and IT systems.
For each of these stakeholder questions, visual workflow documentation provides the anchoring artifact. The workflow visualization shows where AI operates (addressing the ROI question), how AI integrates with other systems (addressing the connectivity question), and where compliance controls are embedded (addressing the compliance question).
Change management in digital transformation projects consistently identifies visible, accessible process documentation as one of the most effective tools for reducing employee resistance. When employees can see that the new process design acknowledges their role, that human judgment is required at specific defined points, and that AI handles the routine steps they find most tedious, acceptance improves significantly.
Once implementation begins, AI workflow visualizations serve as the authoritative reference against which development work is validated. Requirements that exist only as text descriptions are interpreted differently by different development team members. Requirements that exist as visual process diagrams are significantly less ambiguous.
Only about half of all respondents say their companies establish a clean, structured data foundation before scaling digital initiatives, while 60% tell us that poor data quality has had some impact on achieving value for those initiatives.
Workflow visualization addresses data quality in the governance phase by making data flows visible — showing which data enters the process at each step, how it is transformed, and where it must meet specific quality standards for subsequent steps to work correctly. Data quality requirements that are invisible in text specifications become visible as design constraints in workflow diagrams.
AI workflow visualizations do not retire after implementation. They become the living documentation that operations teams use to monitor process performance, identify optimization opportunities, and manage ongoing process changes.
AI-driven workflows analyze bottlenecks and suggest faster, smarter paths to improve outcomes. This leads to cost savings, improved efficiency, and better customer experiences.
When the monitoring data from deployed AI workflows is fed back into the visualization layer — showing where actual process performance deviates from the designed process, where bottlenecks have emerged, and where AI confidence is lower than expected — the optimization conversation happens on the same visual canvas where the design conversation happened.
Traditional diagramming tools require manual creation of every diagram element. A transformation project spanning a complex, multi-system workflow might require dozens of process maps covering every workflow variation, every exception path, and every integration point. Creating those diagrams manually is prohibitively slow, and maintaining them through the continuous design iteration of an active transformation project is practically impossible.
What digital transformation projects need is a tool that generates visual workflow diagrams from the design conversations that are already happening — and that makes those diagrams updateable at the speed of design change.
FlowcastGPT is an AI-powered workflow visualization platform with 100K+ users that converts plain-language descriptions, requirements text, and process logic into structured, editable workflow diagrams — instantly. For digital transformation projects specifically, FlowcastGPT provides the visualization capability that converts strategy into visible process design.
Natural Language to Workflow Diagram Describe a business process in conversational language — "when a customer submits a loan application, it goes to automated credit scoring, then to a human underwriter if the score is between 580 and 720, then to final approval" — and FlowcastGPT generates a structured flowchart or swimlane diagram immediately. The process design that previously required a business analyst session and a Visio file now exists as a visual artifact within minutes of the design conversation.
Cross-Departmental Workflow Coverage Digital transformation projects span functions. FlowcastGPT supports workflow visualization across engineering, operations, IT, DevOps, finance, HR, and customer-facing functions — producing diagrams appropriate for each audience without requiring different tools for different teams.
AI-Driven Process Analysis Beyond generating diagrams, FlowcastGPT identifies bottlenecks and optimization opportunities within existing workflow visualizations — surfacing improvement suggestions that align with the AI workflow design principles that PwC and McKinsey identify as the key to transformation ROI.
Real-Time Data Synchronization As the digital transformation project evolves and process designs change, FlowcastGPT keeps workflow diagrams current — eliminating the documentation drift that makes traditional process maps useless within weeks of a fast-moving project.
Enterprise System Integration FlowcastGPT connects to CRMs, cloud platforms, and enterprise systems, making workflow diagrams operationally connected rather than standalone documentation artifacts. For digital transformation projects that need to show how new workflows connect to Salesforce, SAP, or other enterprise systems, this connectivity makes the visualization actionable rather than illustrative.
A digital transformation project deploying Salesforce Agentforce for customer service needs to design which customer interactions the AI agent handles autonomously, which require human escalation, and how the handoff from agent to human works.
Using FlowcastGPT: describe the intended customer service workflow in plain language, including the types of customer queries, the AI agent's decision criteria for escalation, and the human agent's responsibilities after escalation. FlowcastGPT generates a swimlane diagram showing the AI agent's lane and the human agent's lane, with explicit handoff points and decision logic visible at each step.
This diagram becomes the design specification that the implementation team configures from, the training material that human service agents prepare with, and the governance reference that compliance teams use to validate that the deployment meets the organization's human oversight requirements.
Check out: AI Diagram Generator - The Complete Guide for Teams and Enterprises
Complex workflows become easier to understand when represented visually.
Instead of reading hundreds of pages of documentation, teams can immediately identify:
This accelerates planning and solution design.
Workflow visualization reduces ambiguity before development begins.
Teams spend less time clarifying requirements and more time building solutions.
This often results in:
Digital transformation requires collaboration across multiple departments.
Visual workflows enable everyone—from executives to developers—to speak the same language.
This improves:
Many AI projects fail because requirements evolve during implementation.
Workflow visualization identifies potential issues early.
Organizations can validate workflows before writing code, reducing:
Visualization helps organizations identify repetitive tasks suitable for automation.
Examples include:
AI can then be introduced where it delivers maximum business value.
Check out: AI Diagramming Tools vs Diagram-as-Code: Which Is Better?
Every digital transformation project should begin with a visual representation of the current state — not the aspirational future state. The current state diagram reveals:
The gap between the current state and the designed future state, visualized side by side, makes the transformation value proposition concrete for every stakeholder — from the CEO who approved the investment to the operations manager whose team will execute the new process.
Spell it out. As you design a new agentic workflow, map it step-by-step, specifying where agents own the work, where people do, where people and agents collaborate, and how oversight can take place for each step.
The most common failure mode in AI workflow design is vagueness about step-level ownership. A process design that says "AI handles routine queries" is not a design — it is an intention. A process design that shows, at the swimlane level, which specific query types go to AI and which go to human review, with explicit criteria for the routing decision, is a design that can be implemented and governed.
FlowcastGPT's swimlane diagram generation naturally enforces this specificity — because placing an activity in a swimlane requires assigning it to either the AI agent lane or the human lane. The diagram structure prevents the vagueness that text-based process specifications enable.
Digital transformation projects routinely focus the design effort on the happy path — the workflow as it should go when everything works correctly. But AI workflows must also handle exception paths: what happens when the AI agent's confidence is below threshold? When external system data is unavailable? When the customer query falls outside the agent's defined scope?
Including exception paths in the workflow visualization serves two purposes: it forces the design team to make decisions about exception handling that would otherwise be deferred to the implementation team (who will make them without the business context the design team has), and it documents those decisions in a form that compliance and governance teams can validate.
A workflow diagram that shows employees exactly what the new process looks like — which steps they are responsible for, what information AI provides them, where they exercise judgment — is the most effective change management artifact available. More effective than a presentation, more accessible than a requirements document, and more honest than a leadership message about transformation benefits.
When employees can see that the transformation design respects their judgment — that AI handles the routine and humans handle the complex — resistance is replaced by engagement. When the diagram makes clear that a previously tedious process step has been automated, employees see concrete benefit rather than abstract technology promise.
Digital transformation projects change continuously. A workflow diagram that was accurate in March may be outdated by May. Maintaining workflow diagrams in a version-controlled environment — where the evolution of the process design is traceable — serves both project governance and post-implementation audit requirements.
Enterprise buyers are asking whether AI improves workflow visibility, whether it can support compliance, and how well it connects with ERP, CRM, HRMS, finance, procurement, and IT systems.
Compliance support in AI workflow deployments requires demonstrable evidence of how the process was designed, when design decisions were made, and what governance was in place. Version-controlled workflow diagrams provide that evidence automatically.
The most technically accurate workflow diagram produced by the design team may still miss operational realities that only the people executing the process know about. Before any workflow diagram is promoted to implementation specification, it should be reviewed by the operators, customer service representatives, or process specialists who will work within the designed process.
These reviews frequently surface:
AI can visualize and automate customer support workflows involving:
Result:
Faster response times and improved customer satisfaction.
Healthcare organizations use AI workflow visualization for:
Banks visualize AI-powered workflows for:
Manufacturers optimize:
HR teams automate:
Also check: Integrating AI Diagramming Tools into Your Existing Design Stack
A workflow design conversation that would previously produce meeting notes and a follow-up Visio file in two weeks produces a visual diagram in the same meeting. The alignment that the diagram enables — stakeholders engaging with a shared visual artifact rather than individual text interpretations — happens faster.
AI delivers its strongest value in speed-oriented activities: prototyping, code suggestions and documentation support. These gains are immediate and visible. The implication for 2026 is clear: AI needs to be embedded into systems that enforce quality and consistency — not layered on top of them.
Requirements misunderstandings that would produce rework in a text-specification environment are caught in diagram review. A swimlane diagram that incorrectly assigns a step to the AI agent when the business intended it for human review is correctable in minutes during design. The same misunderstanding discovered during implementation is correctable in days or weeks of rework.
Regulatory and compliance requirements for AI workflows — explainability, human oversight, audit trails — are documented in the workflow visualization as a natural byproduct of the design process. The compliance artifact is the design artifact.
When employees can see the new process clearly, change management proceeds faster. The visualization removes ambiguity about what the transformation means for individual roles, replaces fear of the unknown with a clear picture of the new operating model, and makes the benefits concrete rather than aspirational.
Workflow visualization plays a critical role throughout digital transformation initiatives.
Process Discovery
Organizations first analyze existing workflows.
Visualization identifies:
Process Redesign
Once inefficiencies are identified, optimized workflows are designed.
AI capabilities are integrated strategically instead of simply replacing manual tasks.
Development
Developers build solutions based on validated workflow diagrams.
This reduces ambiguity and accelerates implementation.
Testing
Visual workflows simplify testing by clearly defining expected outcomes.
QA teams can validate:
Continuous Optimization
Post-deployment analytics reveal opportunities for further improvements.
Organizations continuously refine workflows based on real-world performance.
Several technologies are reshaping AI workflow visualization:
These innovations are enabling organizations to design smarter, faster, and more adaptive digital transformation initiatives.
AI workflow visualization is the use of artificial intelligence to automatically generate, maintain, and optimize visual representations of business processes — converting requirements, descriptions, and process logic into structured diagrams including flowcharts, swimlane maps, BPMN models, and sequence diagrams. In digital transformation projects, it provides the visual clarity needed for stakeholder alignment, implementation governance, compliance documentation, and change management.
Digital transformation projects routinely fail at the alignment layer — different stakeholders have different understandings of how the transformed process should work. Technology delivers only about 20% of a transformation initiative's value. The other 80% comes from redesigning work. Visualizing that redesign makes it a shared artifact rather than an individual understanding, enabling the cross-functional alignment that transformation requires.
AI workflow visualization tools generate flowcharts, swimlane diagrams, BPMN process models, UML sequence diagrams, state machine diagrams, entity-relationship diagrams, data flow maps, and user journey maps — each appropriate for different audiences and different types of process documentation within a digital transformation project.
By explicitly documenting where AI agents operate autonomously, where human oversight is required, and what compliance checkpoints exist at each stage, workflow visualizations provide the compliance documentation that regulatory frameworks require for AI systems. The design artifact becomes the audit artifact.
Traditional process mapping requires manual diagram creation by specialists, produces outputs that non-specialists struggle to engage with, and cannot be maintained at the speed of transformation project change. AI workflow visualization generates diagrams automatically from existing inputs (descriptions, requirements, code), produces outputs accessible to all stakeholders, and enables rapid regeneration when processes evolve.
FlowcastGPT converts plain-language process descriptions into structured, editable workflow diagrams instantly — with support for cross-departmental swimlane diagrams, AI-driven process analysis, real-time diagram updating, and enterprise system integration. For digital transformation projects, it provides the visual workspace where current-state processes are mapped, future-state designs are developed, and implementation specifications are maintained.
According to McKinsey, enterprises can automate up to 50% of their workflows with AI, unlocking significant efficiency and cost benefits. However, 2026 will separate companies that only use AI as a productivity assistant from companies that use AI to redesign how work moves across the organization. Workflow visualization is the instrument of redesign — it makes visible which 50% should be automated and how the human-AI collaboration for the remaining 50% should be designed.
The organizations that lead in digital transformation in 2026 will not be those that deployed the most AI tools. They will be those that redesigned how work moves — replacing manual handoffs with intelligent automation, replacing siloed systems with connected workflows, and replacing iterative human execution with continuous AI-assisted processing.
Businesses that combine AI, workflow automation, no-code platforms, integrations, governance, and human oversight will be better positioned to reduce manual effort, improve speed, control costs, and scale automation safely.
Governance and human oversight are in that list alongside AI and automation — because transformation at scale requires that every stakeholder, from the board to the frontline employee, can see, understand, and trust how the AI-driven process works.
AI workflow visualization is not documentation that follows transformation. It is the design instrument that precedes it — the visual canvas on which the transformed process is designed before it is built, aligned before it is deployed, and governed after it is live.
Just 34% are truly reimagining the business despite widespread AI adoption. The organizations doing the reimagining share one characteristic: they are making the new design visible before they build it. Workflow visualization is how that visibility is created.
The organizations that build that visibility systematically — using AI to generate, maintain, and optimize their workflow diagrams throughout the transformation lifecycle — are the ones that will look back on 2026 as the year their transformation investments compounded into durable competitive advantage.