Every software development project, product launch, and process improvement initiative starts with a requirements document. Sometimes it is a formal PRD with structured user stories. Sometimes it is a collection of bullet points from a discovery session. Sometimes it is a 40-page business requirements document produced by a consultant. Sometimes it is meeting notes with action items distributed across three different formats.
Whatever its form, the requirements document is where the project's intent lives. And the gap between that intent and a shared understanding of how the system should work is one of the most consistent sources of rework, misalignment, and wasted development effort.
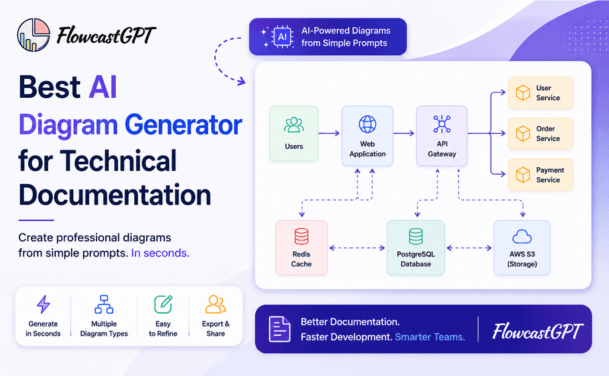
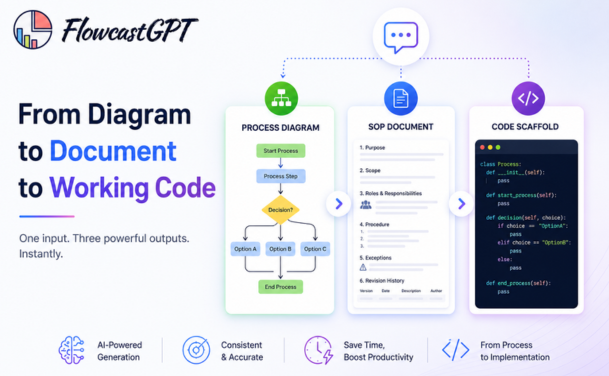
Visual diagrams close that gap. A process flow diagram that shows the sequence of steps a user takes through an onboarding workflow communicates in seconds what a written description takes paragraphs to convey — and communicates it with enough clarity that different stakeholders see the same picture. A UML sequence diagram showing how a REST API handles authentication errors is immediately comprehensible to the engineer implementing it and the QA professional testing it in a way that a written specification often is not.
The problem has never been that diagrams are not valuable. The problem has been that creating them is time-consuming enough that they are consistently deprioritized. In a project moving at sprint velocity, spending three hours in a diagramming tool to produce a diagram that will be outdated in two weeks has never made economic sense.
In 2026, that calculation has changed. AI diagram generators have moved beyond novelty into genuine productivity tools. The text-to-diagram workflow is now fast enough and accurate enough to replace manual diagramming for most use cases. Requirements text that previously required an afternoon of manual diagram construction can now produce a first-draft diagram in under two minutes — editable, shareable, and ready for stakeholder review before the next meeting.
This guide covers the complete workflow: what types of diagrams can be generated from requirements documents, how to prepare your requirements for optimal AI interpretation, and how to integrate this workflow into your team's standard documentation process.
Read: AI Flowchart Generator for Software Development Teams - A Complete Guide
In software development, business analysis, project management, and digital transformation initiatives, requirements documents serve as the foundation for successful project execution. However, lengthy requirement specifications often create communication challenges between stakeholders, business teams, developers, architects, and project managers.
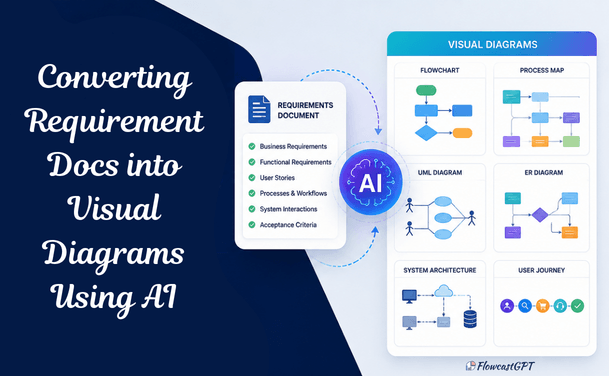
Visual diagrams help bridge this gap by transforming complex textual requirements into easy-to-understand workflows, process maps, system architectures, user journeys, and UML diagrams.
Traditionally, creating these diagrams has been a manual, time-consuming process requiring significant effort from business analysts and solution architects. Today, Artificial Intelligence (AI) is changing the game by automatically converting requirements documents into meaningful visual representations within minutes.
This article explores how AI-powered tools transform requirements into diagrams, the benefits they offer, the implementation process, and best practices for achieving accurate results.
Requirements documents are written by people who understand the system. They are read by people who are building their understanding. This asymmetry creates comprehension gaps that manifest as bugs, re-work, and misaligned features — even when everyone has technically read the same document.
Research consistently shows that visual representations improve comprehension, retention, and alignment across different audiences. A diagram communicates structure, sequence, and relationships in ways that prose descriptions require significantly more cognitive effort to convey.
The specific value of converting requirements to diagrams:
For product managers: Diagrams validate whether the written requirements actually make logical sense. The act of converting requirements to a flow diagram reveals gaps, contradictions, and missing edge cases that prose descriptions often obscure.
For engineering teams: Diagrams provide implementation clarity that reduces interpretive variance. Two engineers reading the same written requirement can implement it differently. Two engineers working from the same flow diagram are much more likely to implement it consistently.
For QA teams: Diagrams directly translate into test case structure. Each decision point in a flowchart is a test case. Each path through a sequence diagram is a scenario to validate.
For stakeholders and executives: Diagrams communicate complex system behavior without requiring domain expertise in the underlying technology. A business stakeholder can review a user journey diagram and immediately identify whether it reflects the intended customer experience — even if they could not parse the equivalent user story.
The reason requirements documentation historically produced fewer diagrams than it should: time. The days of staring at a blank canvas are over. But for most of the history of diagramming tools, staring at a blank canvas was exactly what you did — before dragging shapes, drawing connectors, aligning elements, and applying styling to produce something that communicated as well as it could have if someone had just sketched it on a whiteboard and photographed it.
With AI, you describe what you need. The tool produces a structured, editable diagram. You refine it. The total time is a fraction of the manual alternative, and the output quality is — for most standard diagram types — immediately usable.
Also read: AI Diagram Generator: The Complete Guide for Teams and Enterprises
AI-powered diagram generation uses Natural Language Processing (NLP), Large Language Models (LLMs), and machine learning algorithms to analyze requirements documents and automatically generate visual representations.
The AI can identify:
Based on this analysis, AI creates structured diagrams without requiring extensive manual design effort.
Understanding which diagram types are most valuable for different requirements artifacts is the first step to using AI effectively.
Best for: Business process requirements, decision logic, approval workflows, user task sequences
A flowchart represents the sequence of steps, decisions, and outcomes in a process. When a requirements document describes how a system handles a user action — what happens when they submit a form, how a request moves through an approval chain, what the system does when a payment fails — a flowchart makes that sequence immediately visual.
When to generate: Any time requirements describe a sequence of events with conditional branches.
Best for: API specifications, integration requirements, authentication flows, multi-system interactions
A UML sequence diagram shows how different participants (users, systems, services, databases) interact with each other over time, displaying the sequence of messages passed between them. It is the standard diagram for documenting how a feature works at the system level.
When to generate: Any time requirements describe interactions between two or more systems or services, particularly APIs, authentication flows, and integration requirements.
Best for: Database design specifications, data model requirements, system data architecture
An ERD shows the entities in a system, the attributes of each entity, and the relationships between them. For any requirements that describe the data a system manages — what objects exist, what information each object contains, how objects relate to each other — an ERD translates that specification into a visual data model.
When to generate: When requirements define the data objects a system manages and how they relate to each other.
Best for: Customer experience requirements, user research findings, UX specifications, service blueprints
A user journey map visualizes the stages a user goes through to accomplish a goal — their actions, thoughts, feelings, and pain points at each stage. For product and UX requirements, a journey map communicates the intended user experience in a form that cross-functional stakeholders can evaluate without technical knowledge.
When to generate: When requirements describe the experience a user should have — not just the functionality the system should provide.
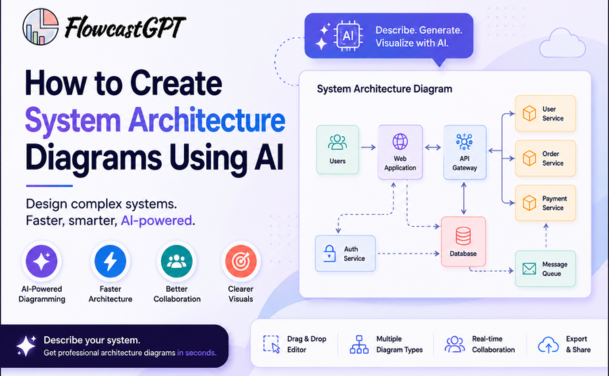
Best for: Infrastructure requirements, microservices architecture, cloud deployment specifications, integration architecture
A system architecture diagram shows how the technical components of a system are organized and how they interact. For technical requirements documents — infrastructure specifications, cloud architecture requirements, API design documents — AI can generate architecture diagrams that make the technical design immediately comprehensible.
When to generate: When technical requirements describe system components and their relationships.
Best for: Handoff requirements, approval processes, multi-team workflows, business process reengineering
A swimlane diagram organizes a flowchart by participant — each "lane" represents a different person, team, or system, and activities are placed in the lane of whoever is responsible for them. For requirements that involve multiple teams or systems, a swimlane diagram makes handoffs, responsibilities, and dependencies immediately visible.
When to generate: When requirements involve activities performed by multiple distinct parties — and when accountability for each step matters for the implementation.
Best for: Order management requirements, subscription lifecycle requirements, workflow state machines
A state diagram shows the different states an object can be in and the events that cause transitions between states. For requirements that define the lifecycle of a key domain object — an order moving from pending to processing to shipped to delivered, a subscription moving from trial to active to suspended to cancelled — a state diagram makes the lifecycle immediately clear.
Check out: AI Diagramming Tools vs Diagram-as-Code: Which Is Better?
AI performs best when requirements are:
Recommended formats:
Modern AI platforms allow users to upload:
The AI then processes and analyzes the content.
The AI identifies:
This forms the foundation for visual diagram generation.
The system automatically creates:
This process often takes only a few minutes.
Although AI significantly reduces manual effort, human validation remains important.
Review:
Subject matter experts should verify outputs before implementation.
Generated diagrams can be shared with:
This improves communication and alignment across teams.
Also check: Integrating AI Diagramming Tools into Your Existing Design Stack
Manual diagram creation can take hours or days.
AI reduces this to minutes.
AI consistently applies analysis rules and identifies relationships that may be overlooked manually.
Visuals help both technical and non-technical audiences understand requirements quickly.
Teams gain better visibility into:
Misunderstood requirements are one of the leading causes of project delays.
Visual diagrams help eliminate ambiguity.
Business analysts and architects can focus on strategy rather than repetitive documentation tasks.
Poorly written requirements can lead to inaccurate diagrams.
Solution:
Use structured requirements templates and clear language.
AI may not understand undocumented business rules.
Solution:
Provide supporting documentation and context.
AI-generated diagrams should not replace expert review.
Solution:
Combine AI speed with human validation.
Check: How to Integrate AI Diagramming Tools into Your Workflow
Clearly defined sections improve AI accuracy.
Consistent naming conventions produce better outputs.
Review generated diagrams before approval.
Updated documentation ensures diagrams remain accurate.
Different stakeholders benefit from different visual representations.
As AI technology continues to evolve, future solutions will likely:
Organizations that adopt AI-driven visualization tools today will gain a significant advantage in project planning, stakeholder communication, and digital transformation initiatives.
Read: Key Considerations When Choosing an AI Diagramming Tool for Complex System Architectures
The quality of AI-generated diagrams scales directly with the quality of the input. Poorly structured, ambiguous requirements produce vague, incomplete diagrams that require significant editing. Well-structured requirements produce accurate, complete diagrams that require only minor refinement.
AI tools perform significantly better when told what type of diagram to generate. Include the diagram type in your prompt — do not assume the AI will infer the right output format from your requirements text.
Less effective: "Here is our payment processing requirement. Please visualize this."
More effective: "Convert the following requirement into a UML sequence diagram showing the interactions between the payment service, bank API, and order management system."
Requirements documents frequently refer to participants (users, systems, services) by different names in different sections. Before converting to a diagram, standardize the participant names and list them explicitly.
Less effective: "The customer submits the form. The platform sends it to the processor. After the bank responds, the app updates the record."
More effective: "Participants: Customer (browser), Order Service, Payment Gateway (Stripe), Bank API. Flow: Customer submits payment form to Order Service..."
The branches in a flowchart or state diagram correspond to decision points in the requirements. Requirements text often describes these implicitly — "if successful," "when approved," "in case of failure." Make each decision point explicit before converting.
Less effective: "The order is processed and the customer is notified."
More effective: "If order processing succeeds: send confirmation email and update order status to 'confirmed'. If order processing fails: retry once after 5 minutes. If retry fails: send failure notification and update status to 'failed'."
For entity-relationship diagrams, explicitly state the cardinality of each relationship — one-to-one, one-to-many, many-to-many.
Less effective: "Customers have orders and orders have products."
More effective: "Each Customer can have zero or more Orders (one-to-many). Each Order contains one or more Order Items (one-to-many). Each Order Item references exactly one Product (many-to-one)."
Requirements documents often blend what the system should do with how it should be implemented. For diagram generation, separate these. What the system does (behavior) maps to flowcharts, sequence diagrams, and state diagrams. How it is built (implementation) maps to architecture diagrams and class diagrams.
Feeding mixed scope/implementation text to an AI diagram generator produces inconsistent output. Separate the layers first, then convert each layer to its appropriate diagram type.
AI-generated diagrams require human validation before they are used as authoritative references. The validation process is significantly faster than manual diagram creation — but it is not optional.
Also read: How QA Teams Can Use AI Diagram Generators
AI diagram generators produce better output from focused, scoped input than from complete, multi-section requirement documents. Pasting a 40-page BRD and asking for "a diagram" produces unfocused output that does not match any specific diagram type. Extract the relevant section and specify the diagram type explicitly.
The common thread across all these tools is that the text-to-diagram workflow is now fast enough and accurate enough to replace manual diagramming for most use cases. Fast and accurate does not mean perfect. First-draft AI diagrams require validation. Make review and validation a standard step — not an optional enhancement.
AI can convert what is written into a visual format. It cannot supply missing requirements. If the requirements text is incomplete — missing edge cases, undefined error handling, ambiguous relationships — the diagram will be incomplete. The diagram validates requirements; it does not create them.
Most AI diagram tools support iterative refinement — you can ask for modifications to a generated diagram through follow-up prompts rather than starting from scratch. Many users do not realize this and regenerate from scratch when they need a small modification. Use the conversation to refine.
Example refinement prompts:
Different stakeholders need different diagram formats. A developer needs Mermaid code they can embed in documentation. A project manager needs a PNG they can add to a slide. A business analyst needs an editable Lucidchart diagram they can modify in a review meeting. Match the output format to the downstream use before generating.
Requirements documents are essential, but text alone often creates communication barriers and slows project execution. AI-powered diagram generation transforms complex requirements into clear visual representations, enabling teams to understand processes, workflows, architectures, and user journeys more effectively.
By leveraging AI, organizations can accelerate requirement analysis, improve collaboration, reduce misunderstandings, and enhance overall project outcomes. Whether you're working on software development, business process improvement, enterprise architecture, or digital transformation, AI-generated visual diagrams can significantly improve how requirements are interpreted and executed.
As AI capabilities continue to advance, converting requirements documents into visual diagrams will become a standard practice for modern organizations seeking greater efficiency, clarity, and project success.