Software development has become increasingly complex, involving multiple stakeholders, intricate workflows, agile methodologies, DevOps pipelines, and continuous delivery processes. Visualizing these processes effectively is critical for project success. This is where AI flowchart generators are transforming the way software development teams plan, document, and optimize workflows.
Traditional flowchart creation can be time-consuming and prone to inconsistencies. AI-powered flowchart generators automate diagram creation, streamline collaboration, and help teams convert ideas into visual workflows within minutes.
In this comprehensive guide, we'll explore what AI flowchart generators are, how they benefit software development teams, key features to look for, popular use cases, and best practices for implementation.
Before exploring specific use cases, the adoption data establishes why this conversation is urgent for engineering leaders.
Adoption is nearly universal. 97% of organizations are using or evaluating AI in software development. The 3% who aren't are now the outliers.
The 2025 Stack Overflow survey shows that 84% of respondents were using or planning to use AI tools with 51% of professional developers using them daily.
McKinsey research has found that AI can improve developer productivity by up to 45% — but code generation is only one part of the story. AI is already starting to have a positive influence on SDLC from end to end, collapsing stages, automating workflows and integrating intelligence throughout.
The classic 6-phase SDLC took 6–12 months. In 2026, AI Agent Teams have compressed every phase — delivering production software in 6–12 weeks at 10–20x velocity.
Within this broader AI adoption trend, visual documentation — flowcharts, architecture diagrams, system maps — represents one of the highest-leverage, lowest-risk AI applications for development teams. Unlike AI code generation (which requires review, carries quality risk, and demands engineering judgment), AI-generated flowcharts can be validated visually in seconds and corrected with a simple edit.
In 2026, flowcharts are operational tools, not just visual aids. Teams use them to define approval paths, document decision logic, map automation systems, and clarify internal processes. Clear workflows reduce confusion and speed up execution.
An AI flowchart generator is a tool that uses large language models and layout algorithms to automatically create structured visual diagrams from natural language descriptions, code, or technical specifications.
For software development teams specifically, this means:
A user can describe a workflow in plain language and receive a properly connected flowchart with decision points and logical branches.
General-purpose AI flowchart tools generate diagrams for any business user. Software development teams have more specific requirements:
Read: AI Diagram Generator: The Complete Guide for Teams and Enterprises
The most accessible input mode. A developer describes the flow, system, or logic in plain English.
Example prompt: "Create a sequence diagram showing the authentication flow for a REST API with JWT tokens — including the client request, server validation, token generation, and error handling paths."
Output: A properly formatted UML sequence diagram in under 60 seconds.
The developer pastes a function, class, module, or SQL schema and the AI infers the visual structure.
Example input: A Python function with multiple conditional branches
Output: A flowchart showing each code path, decision point, and return value
The developer provides an existing specification, PRD, or technical brief.
Example input: A feature specification describing a multi-step checkout process
Output: A swimlane flowchart showing each system component's responsibilities
Developers write diagram markup (Mermaid, PlantUML) and the AI assists in generating, completing, or translating that markup into rendered visuals.
As the demand for smarter and faster solutions grows, AI flowchart generators remove manual effort. Instead of constructing diagrams step by step, users describe a workflow in plain language and the system converts that description into a structured, editable flowchart.
Faster Workflow Creation
AI reduces hours of manual diagramming to just a few minutes.
Reduced Human Error
Automated diagram generation minimizes mistakes and inconsistencies.
Better Team Communication
Visual workflows help technical and non-technical stakeholders understand project requirements.
Improved Scalability
As systems grow more complex, AI can quickly update and expand diagrams.
Knowledge Retention
Flowcharts preserve institutional knowledge and make onboarding easier for new team members.
Enhanced Decision-Making
Clear visualizations help leaders identify process improvements and allocate resources effectively.
Also read: AI Diagramming Tools vs Diagram-as-Code: Which Is Better?
Agile teams require flexibility and rapid adaptation. AI flowchart tools align perfectly with Agile methodologies by enabling:
Quick Iterations
Update workflows instantly as requirements evolve.
Sprint Visualization
Represent sprint cycles and task dependencies visually.
Retrospective Analysis
Identify bottlenecks and opportunities for process improvement.
Cross-Team Alignment
Ensure developers, QA teams, and stakeholders share a common understanding.
To maximize value, follow these recommendations:
Start with Clear Inputs
Provide detailed prompts so AI can generate accurate diagrams.
Review Generated Workflows
Always validate AI-generated diagrams before implementation.
Keep Diagrams Updated
Regularly refresh workflows as project requirements change.
Standardize Diagram Formats
Establish organization-wide standards for consistency.
Integrate with Existing Tools
Connect flowchart software with project management and development platforms.
Train Team Members
Ensure all stakeholders understand how to use and interpret AI-generated diagrams.
Check: Integrating AI Diagramming Tools into Your Existing Design Stack
While AI flowchart generators offer significant advantages, organizations should be aware of potential limitations.
Context Understanding
AI may occasionally misunderstand complex requirements.
Customization Constraints
Some tools may have limited customization capabilities.
Security Concerns
Organizations handling sensitive information should verify data privacy and compliance standards.
Dependency on Input Quality
The quality of generated diagrams depends heavily on the quality of user prompts.
The planning phase is where AI flowchart generation delivers some of its earliest and most visible value. AI agents process a product brief and generate a first-draft technical specification, user story map, data model, and API schema within hours. Senior engineers review, refine, and approve. What took weeks now takes 1–2 days.
Time impact: Planning-phase documentation that previously required a full-day workshop can be generated, reviewed, and iterated in under two hours.
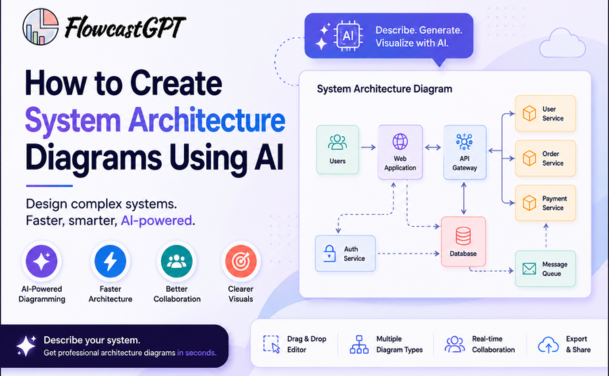
System architecture documentation is where misalignment between what was designed and what was built is most costly — and most common. System design allows architects and engineers to use AI tools to map out system structures and data flows.
The key advantage: When architectural decisions change — and they always do — updating an AI-generated diagram takes seconds rather than a full redesign session. This makes architecture documentation sustainable rather than aspirational.
Algorithm visualization involves displaying complex algorithms or decision trees in software development. This use case is particularly valuable for onboarding, code review, and debugging complex business logic.
Every API integration requires clear documentation of request flows, response handling, error paths, and authentication sequences. Without this documentation, integrations are reverse-engineered from code, debugging takes longer, and third-party integrators face unnecessary friction.
Real-world value: Some tools can create flowcharts from simple text prompts or even existing code snippets, which is a huge plus for development teams. An API integration that would take a technical writer a day to document can be visualized in minutes.
Continuous Integration and Continuous Delivery pipelines are among the most complex workflows in modern software teams — and among the least visually documented. Visualizing the pipeline helps with onboarding new DevOps engineers, debugging pipeline failures, and planning pipeline changes.
Teams use flowcharts to define approval paths, document decision logic, map automation systems, and clarify internal processes. CI/CD pipelines are the most critical approval path in any engineering organization.
When a production incident occurs, the pressure to resolve it quickly is in direct conflict with the need to document what happened. AI flowchart generators compress this tension by making post-incident documentation fast enough to actually happen before the team moves on to the next sprint.
The documentation discipline payoff: Teams that maintain accurate incident response flowcharts reduce mean time to recovery (MTTR) in subsequent incidents because responders can navigate a known path rather than discovering it under pressure.
The most expensive knowledge loss in software teams happens during engineer transitions. When a senior engineer leaves or a team is reorganized, the undocumented system knowledge that lived in their head takes months to reconstruct. AI flowchart generators create a sustainable documentation habit that preserves this knowledge before it walks out the door.
In 2026's fast-moving environment, AI flowchart makers help organizations save time while producing consistent, presentation-ready process visuals that drive execution across product, ops, compliance, and customer success.
Also check: How to Integrate AI Diagramming Tools into Your Workflow
FlowcastGPT combines AI-powered workflow visualization with intelligent process management — making it particularly valuable for engineering and operations teams that need diagrams to connect to actual workflow automation rather than serving as standalone documentation.
Key strengths for dev teams:
Best for: Engineering teams that want diagrams embedded in a broader workflow automation context — where the diagram is not just documentation but the starting point for operational change
Eraser.io offers a developer-oriented AI flowchart generator for 2026. It can convert structured text or logical descriptions into diagrams. The platform focuses on clarity of logic rather than decorative styling.
Eraser is purpose-built for the software development workflow. Its DiagramGPT feature converts technical descriptions, system narratives, and code snippets into clean architecture diagrams and flowcharts. The diagrams-as-code approach means diagrams can be version-controlled alongside the codebase in Git.
Key strengths for dev teams:
Best for: Engineering and DevOps teams, backend developers, technical architects, and anyone who prefers working in code-adjacent environments
Mermaid is the diagrams-as-code standard for software teams. Its markdown-like syntax renders flowcharts, sequence diagrams, class diagrams, state diagrams, Gantt charts, and more — natively inside GitHub, GitLab, Confluence, Notion, and most major documentation platforms.
AI tools including GitHub Copilot, Claude, and ChatGPT can generate Mermaid code from natural language descriptions, enabling a powerful workflow: describe the diagram, receive Mermaid syntax, render it wherever your documentation lives.
Key strengths for dev teams:
Mermaid in practice:
sequenceDiagram
    Client->>+Auth Server: POST /auth/token
    Auth Server-->>-Client: JWT Token
    Client->>+API: GET /resource (Bearer Token)
    API->>Auth Server: Validate Token
    Auth Server-->>API: Token Valid
    API-->>-Client: 200 OK + Resource Data
This 8-line Mermaid block renders a complete authentication sequence diagram in any supported platform.
Best for: Developers who want diagrams embedded in code documentation, living in version control, and maintained without switching to a separate design tool
Whimsical AI Flowchart Generator creates clean, simple flowcharts from text prompts in 2026. The interface is minimal, which makes it easy to use without a steep learning curve. The platform also supports mind maps and wireframes, making it useful for product design and early-stage planning.
Key strengths for dev teams:
Limitation: Does not support technical diagram types (UML, ERD, network diagrams) — better suited for process flowcharts than system architecture
Best for: Product engineers and front-end teams documenting user flows, feature logic, and interaction patterns
Lucidchart provides the most comprehensive AI diagramming platform for enterprise engineering teams, combining text-to-diagram generation with the broadest library of technical diagram templates — including AWS, GCP, Azure architecture templates, network diagrams, UML, and ERDs.
Key strengths for dev teams:
Best for: Enterprise engineering organizations needing standardized visual documentation across teams, with enterprise security and deep Atlassian/GitHub integration
FigJam's AI will create a starting flowchart from a process description. The Figma app in ChatGPT can now recommend and create AI-generated FigJam diagrams based on conversation, including text-based flow charts, sequence diagrams, state diagrams, and Gantt charts.
Key strengths for dev teams:
Limitation: FigJam isn't built for complex flowcharts. When diagrams grow beyond basic workflows, the limitations of its shape library and layout options become apparent.
Best for: Teams that already use Figma for design, and want flowcharting and design assets in a unified workspace
Miro's AI layer generates flowcharts, mind maps, and user journeys from text prompts, tables, or sticky notes. For engineering teams that regularly collaborate with product, design, and business stakeholders, Miro's infinite canvas bridges the gap between technical diagramming and collaborative ideation.
Key strengths for dev teams:
Best for: Distributed engineering teams that blend diagramming with collaborative planning sessions and need stakeholders from product, design, and business involved in the process
Check out: How QA Teams Can Use AI Diagram Generators
The platform focuses on clarity of logic rather than decorative styling. For engineering documentation, logical accuracy matters far more than visual polish. Avoid choosing tools based on how beautiful the output looks — choose based on technical diagram support, code integration, and version control compatibility.
Diagrams that live in a separate tool from your team's primary documentation platform are diagrams that will fall out of date. Prioritize tools that embed diagrams inside Confluence, Notion, GitHub wikis, or wherever your team actually reads documentation.
46% of developers distrust AI output. 66% cite "almost right but not quite" as their biggest frustration. AI-generated flowcharts require validation — especially for complex branching logic and system interactions. Build a review step into your workflow: generate with AI, validate with a domain expert, publish after confirmation.
Diagrams that try to capture every implementation detail become unreadable. Diagrams that stay too abstract provide no actionable information. For architecture diagrams, the C4 model provides a useful framework: use different levels of abstraction for different audiences — Context level for stakeholders, Container level for engineers, Component level for deep-dives.
A diagram without an owner is a diagram that will become inaccurate. Every published diagram should have a named owner responsible for its accuracy, a defined trigger for updates (code changes, architecture reviews, or quarterly audits), and a process for flagging it as outdated.
Think about the complexity of your work. Do you need a simple tool for quick brainstorming, or a more robust solution that can help you analyze intricate business systems? The right tool should match the scale of your projects. Tool fragmentation across engineering teams creates documentation that cannot be easily shared or maintained. Standardize on one or two platforms for the majority of use cases, and establish clear guidance on when each is appropriate.
Gartner projects 60% of enterprise AI rollouts will include agentic capabilities by end of 2026. The implications for AI diagram generation are significant.
Self-maintaining architecture diagrams: Agentic AI systems will monitor code changes and automatically update corresponding architecture diagrams when service boundaries change, new endpoints are added, or dependencies shift.
Codebase-aware diagram generation: Rather than describing what a system does, developers will point an AI agent at their codebase and receive accurate architecture diagrams generated from what the system actually does — not what someone intended it to do when they wrote the original documentation.
Real-time flow visualization: Diagrams will connect to production monitoring systems, showing live traffic flows alongside the static architecture documentation — creating a dynamic rather than static view of system behavior.
AI-generated postmortems: Following production incidents, AI agents will automatically generate incident timeline diagrams and root cause analysis flowcharts from log data, reducing postmortem documentation time from hours to minutes.
The direction is clear: AI flowchart generation will become increasingly embedded in the development workflow itself rather than a separate documentation activity — making visual accuracy a consequence of good engineering rather than a documentation task that competes with it.
An AI flowchart generator for software development is a tool that converts natural language descriptions, code snippets, API specifications, and technical documentation into structured visual diagrams — including flowcharts, UML diagrams, system architecture maps, and data flow diagrams — automatically and in seconds, without manual drag-and-drop construction.
Yes. Tools like Eraser (DiagramGPT) and Mermaid Chart can generate flowcharts and architecture diagrams from code snippets, SQL schema definitions, and API specifications. Some tools can create flowcharts from simple text prompts or even existing code snippets, which is a huge plus for development teams.
Software development teams use flowcharts for logic documentation, UML sequence diagrams for API and service interaction flows, entity-relationship diagrams (ERDs) for database schemas, system architecture diagrams for service topology, CI/CD pipeline flowcharts for deployment processes, and state machine diagrams for complex stateful logic.
Diagrams-as-code means defining visual diagrams using text-based syntax (like Mermaid or PlantUML) that renders into visual output. It matters for dev teams because diagrams stored as code can be version-controlled in Git alongside source code, reviewed in pull requests, diffed between versions, and embedded natively in GitHub and GitLab — creating diagrams that evolve with the codebase rather than drifting from it.
AI flowchart generators improve efficiency through automation and real-time collaboration features, helping teams complete projects faster and reduce manual work and errors. Teams report 60–80% reduction in documentation creation time, with complex architecture diagrams generated in under 60 seconds versus 30–60 minutes manually.
McKinsey research has found that AI can improve developer productivity by up to 45% — but code generation is only one part of the story. AI is already starting to have a positive influence on SDLC from end to end, collapsing stages, automating workflows and integrating intelligence throughout.
AI-generated flowcharts are accurate for standard patterns and clearly described logic, but require validation for complex systems. 46% of developers distrust AI output, citing "almost right but not quite" as their biggest frustration. The appropriate workflow is: generate with AI, validate with domain knowledge, publish after expert review.
The documentation gap in software teams is not a discipline problem. It is a tooling problem. When creating accurate visual documentation took 30–60 minutes per diagram, the math never worked. In a team shipping multiple features per sprint, documentation consistently lost to development.
In 2026, flowcharts are operational tools, not just visual aids. Teams use them to define approval paths, document decision logic, map automation systems, and clarify internal processes. Clear workflows reduce confusion and speed up execution.
AI flowchart generators change the math. When generating an accurate, editable diagram takes 60 seconds, documentation stops competing with development. It becomes part of it — created when the system is designed, updated when it changes, and consulted when the next engineer needs to understand how it works.
51% of professional developers are now using AI tools daily. The teams that are pulling ahead in 2026 are not just using AI to write code faster. They are using AI to document more thoroughly, communicate more clearly, and transfer knowledge more reliably. Visual documentation is one of the highest-leverage applications of AI in the modern engineering workflow — and one of the lowest-risk places to start.
Choose your tool. Generate your first diagram. Update it when something changes. Build the habit before the documentation debt makes your codebase unintelligible to anyone except the person who wrote it.