Modern software systems are becoming increasingly complex. AI is making architecture design simpler, faster, and more collaborative than ever before.
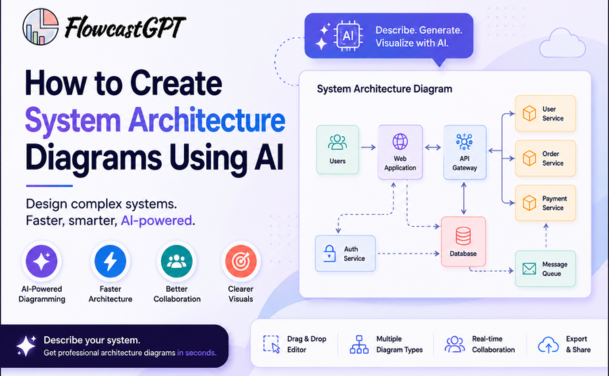
System architecture diagrams are one of the most important artifacts in software development. They help developers, architects, stakeholders, and business leaders visualize how applications, databases, cloud services, APIs, and users interact within a system.
Traditionally, creating these diagrams has been a manual, time-consuming process that requires both technical expertise and specialized diagramming tools.
Today, Artificial Intelligence is transforming architecture design.
Instead of starting with a blank canvas, teams can now generate professional system architecture diagrams using simple natural language prompts, technical documentation, or existing workflows.
This guide covers everything a developer, architect, or technical leader needs to know about creating system architecture diagrams using AI — from the fundamentals of what these diagrams are and why they matter, through a practical step-by-step creation workflow, effective prompting strategies, and the best practices that separate professional-quality AI-generated diagrams from rough first drafts.
Read: Creating SOPs Faster Using AI-Generated Flowcharts
A system architecture diagram is a visual representation of the components, services, data stores, integrations, and relationships that make up a software system. It shows how the elements of a system are organised, how they communicate with each other, and how they connect to external systems and users.
Unlike flowcharts, which represent the sequence of steps in a process, architecture diagrams represent the structure of a system — the what rather than the how. They answer questions like: What services does this system consist of? How does a request travel from the user to the database and back? What external systems does this application depend on? Where are the boundaries between components? What does the data model look like at the schema level?
Architecture diagrams exist at multiple levels of abstraction. A high-level system context diagram shows how an application fits into the broader ecosystem of users and external systems. A component-level diagram shows the internal structure of a service or application. A sequence diagram shows how specific interactions play out over time. An entity relationship diagram shows how data is structured and related at the database level.
Each level serves a different audience and a different design purpose — and each can now be generated using AI from a natural language description of the system.
Understanding which type of diagram to create is the first and most important decision in the architecture documentation process. The most common and most useful types are:
The highest-level architecture artifact. Shows the system as a single box in the centre, surrounded by the users and external systems that interact with it. Answers the question: what is this system, who uses it, and what does it connect to? Appropriate audience: business stakeholders, product managers, and anyone who needs to understand the system's place in a broader ecosystem without needing to understand its internals.
Shows the major deployable units — web applications, mobile apps, APIs, databases, microservices, message queues — that make up the system and how they communicate. This is the diagram that most software architects mean when they say "architecture diagram." It is the most widely used artifact for communicating system structure to engineering teams. Appropriate audience: developers, architects, DevOps engineers, technical leads.
Zooms into a single container to show its internal components — the modules, controllers, services, repositories, and handlers that make up that container and how they interact. Useful for onboarding new team members to a specific service, reviewing internal design decisions, or planning refactoring work.
Shows how components and services interact over time to complete a specific use case or operation — a user login flow, an API request-response cycle, a payment processing sequence. Essential for understanding latency budgets, failure modes, and the logic of complex multi-service interactions. Often the clearest way to communicate integration design to both technical and non-technical audiences.
Shows the data model: the entities (tables), their attributes (fields), and the relationships between them. Critical for database design, storage estimation, query optimisation planning, and data governance work. Often required for compliance and audit documentation.
Shows how data moves through a system — from input sources through processing steps to storage and output destinations. Particularly useful for security reviews (identifying where sensitive data travels), compliance documentation, and designing data pipelines.
Shows where software components are deployed — which services run on which infrastructure, how they are hosted, and how they are networked. Essential for cloud infrastructure planning, DevOps configuration, and understanding the operational characteristics of a system.
Shows processes that span multiple teams, systems, or roles, with each "lane" representing a different actor. Particularly useful for cross-functional workflows, approval processes, and any process where responsibility shifts between parties during execution.
Also read: AI Workflow Visualization for Digital Transformation Projects | Complete Guide
Well-designed architecture diagrams improve communication across teams.
They help organizations:
Without clear architecture documentation, projects become difficult to maintain as systems grow.
Traditional diagram creation presents several challenges.
Time-Consuming
Architects often spend hours creating diagrams from scratch.
Difficult to Maintain
As systems evolve, diagrams quickly become outdated.
Requires Technical Expertise
Many diagramming tools have a steep learning curve.
Documentation Becomes Inconsistent
Different team members often use different standards, symbols, and layouts.
Collaboration Challenges
Keeping architecture diagrams synchronized across distributed teams can be difficult.
AI significantly reduces the effort required to create architecture diagrams.
Instead of manually dragging shapes and connectors, users can describe their systems using natural language.
For example:
"Create an AWS-based e-commerce architecture with React frontend, Node.js API, PostgreSQL database, Redis cache, S3 storage, CloudFront CDN, and Stripe payment integration."
Within seconds, AI can generate a structured architecture diagram.
This dramatically accelerates solution design.
Check out: How to Convert Requirements Documents into Visual Diagrams Using AI
Faster Diagram Creation
Generate professional diagrams in minutes instead of hours.
Consistent Documentation
AI follows standardized architecture patterns, improving documentation quality.
Better Collaboration
Developers, architects, project managers, and business stakeholders can easily understand visual system designs.
Easier Updates
Modify diagrams by updating prompts rather than redesigning everything manually.
Improved Productivity
Teams spend more time designing better systems and less time formatting diagrams.
Before generating any diagram, answer two questions: what decision or understanding does this diagram need to support, and who is the primary audience?
These two answers determine everything else — the level of abstraction, the type of diagram, the components to include, the level of detail in labels and annotations, and the visual complexity that is appropriate.
A diagram created for a board presentation has fundamentally different requirements from one created for an engineering sprint review. A diagram designed to onboard a new developer to a microservices architecture has different requirements from one used to plan a cloud migration. Clarifying purpose and audience before prompting an AI tool prevents the most common failure mode in AI-generated diagrams: generating something technically correct but practically useless for the intended context.
AI generates diagrams from descriptions. The quality of the diagram is directly proportional to the quality and completeness of the description. Before opening FlowcastGPT or any AI diagramming tool, gather the information that will form your description:
For existing systems, this information is often available in existing documentation, code repositories, cloud infrastructure configurations, or team knowledge. For new systems being designed, this information comes from the product requirements and architectural decisions being made.
The single most important skill in AI-assisted architecture diagramming is writing a prompt that gives the AI enough information to generate an accurate, appropriately detailed diagram.
Effective prompts for system architecture diagrams share a common structure:
Specify the diagram type. "Generate a C4 Container diagram," "Create a sequence diagram," "Draw an entity relationship diagram." The AI needs to know which type of diagram to produce before it can produce it well.
Describe the system clearly and specifically. Avoid vague descriptions. "A web application" is not useful. "A B2B SaaS platform with a React frontend, a Node.js REST API, a PostgreSQL database, a Redis cache for session management, and an S3 bucket for document storage" gives the AI what it needs to produce an accurate diagram.
Specify the relationships that matter. Don't assume the AI will infer connection logic. "The API authenticates users via Auth0, reads and writes to PostgreSQL, caches session data in Redis, and stores user-uploaded documents in S3" is specific enough to generate accurate connections.
Include external systems and users. "The system is accessed by two user types: Admins via a web browser and End Users via a mobile app. The API integrates with Stripe for payments and SendGrid for email notifications."
Specify the level of detail. "Include technology labels on each component" or "Show only high-level service boundaries without internal component detail" helps the AI calibrate the appropriate level of information.
Example prompt: "Create a C4 Container diagram for a multi-tenant project management SaaS application. Users include Team Members (web browser) and Admins (web browser). The system consists of: a React frontend hosted on Vercel, a Node.js REST API on AWS Fargate, a PostgreSQL database on AWS RDS, a Redis cache for session management, an SQS queue for async notification processing, and an S3 bucket for file storage. The API authenticates via Auth0, sends emails via SendGrid, and processes payments via Stripe. Label each container with its technology and primary responsibility."
Once the prompt is submitted to FlowcastGPT, the AI generates the diagram output. The first generation is a starting point — not a finished artifact. Review it against the following criteria:
Accuracy: Are all the components present? Are the connections between them correct? Are any important relationships missing? Are any connections shown that should not exist?
Completeness: Is the diagram showing the appropriate level of detail for its intended purpose? Is important context missing that would make it harder for the audience to understand?
Clarity: Is the diagram easy to read? Are labels clear and concise? Is the visual hierarchy logical — are the most important components visually prominent?
Consistency: Are similar components represented consistently? Do labels follow a consistent format and vocabulary?
AI-generated architecture diagrams rarely require no iteration — and that is expected. The refinement process is where human architectural judgment is applied to an AI-generated draft.
Use follow-up prompts to make targeted refinements: "Add a CDN layer between the user's browser and the frontend," "Separate the authentication service into its own container," "Show the data flow between the notification worker and the email service," "Simplify the database layer to show only the primary read/write relationships."
Each refinement prompt should be specific about what to change and why. Vague refinement prompts ("make it clearer" or "add more detail") produce unpredictable results. Specific ones ("label each arrow with the protocol used — REST, GraphQL, or SQS message") produce targeted improvements.
Most well-described systems reach a production-quality diagram within two to four refinement iterations.
A diagram without context is a picture. A diagram with context is a communication tool.
After the core diagram is generated and refined, add the contextual elements that transform it into useful documentation:
FlowcastGPT and most AI diagramming tools provide export options in multiple formats — PNG, SVG, PDF, and increasingly in diagram-as-code formats like Mermaid that can be embedded directly in code repositories and markdown documentation.
For diagrams that need to stay current as systems evolve, storing the AI prompt alongside the exported diagram makes updates significantly easier — regenerate from the updated description rather than manually editing the visual output.
Check: AI Flowchart Generator for Software Development Teams: A Complete Guide
FlowcastGPT is purpose-built for the kind of documentation workflow described in this guide. Rather than requiring architects to learn a specialised diagramming tool or write Mermaid syntax manually, FlowcastGPT accepts plain-language descriptions and generates professional diagrams — together with, where appropriate, structured documentation that mirrors the diagram's content.
The workflow in FlowcastGPT follows the same logic as the step-by-step process above: describe the system, select the diagram type, generate, refine, and export. The platform's AI understands the conventions of system architecture diagramming — standard notations, component hierarchies, connection types, and labelling conventions — without requiring users to specify them explicitly.
For teams that need both a visual diagram and a written procedure or documentation artifact from the same input, FlowcastGPT's dual-output capability generates both simultaneously — the diagram and a structured document — keeping the two aligned without manual synchronisation.
Specify all major deployable units (web apps, APIs, databases, queues, storage), their technologies, and the communication protocols between them. Include external actors (users, third-party services) and indicate whether each connection is synchronous or asynchronous.
Describe the specific use case or user journey being diagrammed (user login, payment processing, order fulfilment). List the participants in order of their appearance in the flow. Describe each message or action in sequence, including any conditional branches (success/failure paths, authentication checks).
List each entity (table) with its primary attributes. Describe the relationship between each pair of related entities — one-to-many, many-to-many, one-to-one — and provide the foreign key logic where relevant. Specify any important constraints (unique fields, nullable relationships, cascade rules).
Describe the infrastructure environment (AWS, Azure, GCP, on-premises). List each service and where it is deployed (EC2 instances, containers, serverless functions, managed services). Describe the network topology: which services are in which VPC, subnet, or availability zone, and how they communicate.
List the actors or systems involved (each becomes a lane). Describe the process step by step, specifying which actor performs each step and what is passed between actors at each handoff point. Include decision points where the process branches based on a condition.
Read: AI Diagram Generator: The Complete Guide for Teams and Enterprises
Over-relying on the first generation. AI-generated architecture diagrams are first drafts. Accepting the first output without review and refinement consistently produces diagrams with missing components, inaccurate connections, or inappropriate levels of detail. The refinement process is where the value of AI generation is realised — it shifts the effort from manual creation to intelligent review and targeted improvement.
Under-specifying the prompt. A vague prompt produces a generic diagram. "Generate an architecture diagram for an e-commerce app" will produce a generic e-commerce architecture that may bear little resemblance to the actual system being documented. Specificity in the prompt is the single most important determinant of output quality.
Mixing abstraction levels. Including both high-level system context information and low-level database schema detail in the same diagram produces a diagram that serves no purpose clearly. Identify the abstraction level required, and keep the description and the prompt consistent with that level.
Creating diagrams without a purpose. Diagrams created because "we should have architecture documentation" rather than because a specific decision, communication need, or documentation requirement exists tend to be ignored. Every architecture diagram should have a specific purpose, a defined audience, and a clear use case.
Neglecting maintenance. A diagram that accurately represents the system at the time of creation but is never updated becomes misleading rather than informative over time. Outdated architecture diagrams actively harm decision-making by providing inaccurate system models to people who trust them.
AI-generated architecture diagrams support numerous industries.
Software Development Visualize web, mobile, and enterprise applications.
Cloud Migration
Design AWS, Azure, and Google Cloud architectures.
Microservices
Map service interactions and APIs.
DevOps
Document CI/CD pipelines and deployment architecture.
Enterprise Applications
Illustrate ERP, CRM, HRMS, and business system integrations.
AI Solutions
Visualize AI pipelines, LLM workflows, vector databases, and agent architectures.
A system architecture diagram visually represents the components, infrastructure, and interactions within a software system.
Yes. AI can create architecture diagrams from natural language prompts, technical documentation, or existing workflows, significantly reducing manual effort.
They save time, improve consistency, simplify collaboration, accelerate documentation, and make it easier to update system designs.
Software development, cloud computing, healthcare, finance, manufacturing, enterprise IT, and AI development all benefit from AI-generated architecture diagrams.
FlowcastGPT combines AI-powered diagram generation with documentation capabilities, enabling teams to create, update, and share professional architecture diagrams quickly and efficiently.
Try FlowcastGPT free and generate your first system architecture diagram in minutes. Describe your system in plain language. Get a professional diagram in seconds.